
The Bias-Debt Audit Template is a comprehensive Excel workbook designed to help you detect, measure, and address algorithmic bias in your marketing automation systems before it costs you customers and revenue. This tool is completely free and you don’t have to provide any contact details to download it.
This template contains 7 tabs:
- Calculator with ROI: Set precision targets and calculate Market Representation Index (MRI) thresholds (START HERE FIRST)
- Quick 30-Min Audit: Fast diagnostic with MRI + z-test statistical validation
- Full Framework Tracker: Track your 5-step audit process
- Revenue Impact Calculator: Quantify the business cost of bias
- Bias Pattern Log: Document and track bias issues over time
- Example Data: Real-world scenario showing statistical significance testing
- Instructions Link: Link to instructions and Creator Info
Executive Overview: What This Template Does
The Problem:
Marketing AI systems amplify historical biases, systematically excluding 10-30% of your target market. This compounds quarterly, costing companies $200K-$500K annually in lost revenue. When algorithms optimize for “easy wins,” they inadvertently screen out viable customer segments—just like the AI hiring system that rejected Derek Mobley and millions of other qualified candidates.
The Solution:
This template provides a 30-minute diagnostic using the Market Representation Index (MRI) + statistical validation (z-test) to identify which segments your algorithms are excluding—and quantify the revenue impact.
What You’ll Get
- ✅ Bias detection across 5 demographic segments (customizable)
- ✅ Statistical significance testing (p-values < 0.05 = confirmed bias)
- ✅ Revenue impact quantification per segment
- ✅ ROI calculator for proposed fixes
- ✅ Quarterly audit framework for ongoing monitoring
Who Should Use This
- Marketing Ops Leads (primary owner)
- Demand Gen Managers (contributor)
- CMOs / VPs Marketing (reviewer)
- Data/Analytics teams (data provider)
Requirements
- 1,000+ conversions with demographic data (preferred)
- Access to ad platform demographic reports (Google Ads, Meta, LinkedIn, etc.)
- 2 hours initial setup, 30 minutes quarterly audits thereafter
Expected Outcomes
- Identify 1-3 critical bias patterns (typical finding)
- Quantify $200K-$500K revenue at risk (average)
- Create remediation roadmap with prioritized actions
- Establish ongoing monitoring with automated alerts
The Business Case
Studies show that excluding market segments costs companies 10-15% potential revenue. The median company in our research discovered $230K annual revenue at risk from algorithmic bias in their first audit, with implementation costs under $15K—a 15x ROI in year one.
Getting Started (First 5 Minutes)
⬇️ Step 1: Download and Open
- Download the Excel template and save the file as:
BiasDebtAudit_[YourCompany]_[Date].xlsx - Open in Microsoft Excel, Google Sheets, or compatible spreadsheet software
- Enable editing if prompted
- Only edit cells highlighted in ORANGE. All other cells are auto-calculated
⚙️ Step 2: Set Up Your Calculator (REQUIRED FIRST STEP) Before using any other tabs, you MUST configure Tab 1: Calculator with ROI
This tab:
- Calculates dynamic Market Representation Index (MRI) thresholds for each segment
- Determines minimum sample sizes needed
- Shows business impact (cost, timeline, ROI)
- Auto-populates values used in Quick 30-Min Audit
Takes 5 minutes to configure. Without this step, the Quick Audit won’t work properly.
🧭 Step 3: Navigation Guide
For first-time users, read sections in order:
- Getting Started (5 min)
- Tab 1: Calculator with ROI (15 min to configure)
- Tab 2: Quick 30-Min Audit (30 min to run)
For experienced users, jump directly to:
- Business Metrics (Section 1) – Update CPA, LTV, conversions
- Actual Sample Size (Section 2) – Enter your sample size
- Segment Analysis (Section 3) – Update TAM and actual conversion %
- Quick 30-Min Audit (Tab 2) – Run your audit
- Bias Pattern Log (Tab 5) – Document findings
For Troubleshooting:
Need to justify investment?
- Revenue Impact Calculator (Tab 4) – Calculate business case
Want comprehensive implementation?
- Full Framework Tracker (Tab 3) – Implement all 5 steps
🎯 Which Tab Should I Use? (Decision Tree)
Start here and follow the path:
Are you running your FIRST audit ever?
✅ YES → Go to Tab 1: Calculator with ROI
- Complete Sections 1-7 (⏱️ 15 minutes)
- Then go to Tab 2: Quick 30-Min Audit (⏱️ 30 minutes)
- Found bias? (MRI < 0.85 or > 1.15 AND p < 0.05)
- ✅ YES → Go to Tab 5: Bias Pattern Log to document
- Then go to Tab 4: Revenue Calculator to quantify cost
- Then implement fixes from article “Four Bias Amplifiers” section
- ❌ NO → Great! Schedule next quarterly audit
- Want comprehensive framework? → Go to Tab 3: Full Framework Tracker
❌ NO → Are you running a QUARTERLY RE-AUDIT?
- ✅ YES → Go directly to Tab 2: Quick 30-Min Audit
- Update Calculator first if business metrics changed (CPA, LTV, conversions)
- ❌ NO → Do you need to JUSTIFY THE INVESTMENT?
- ✅ YES → Go to Tab 4: Revenue Impact Calculator
- Use output to present to leadership
Common paths:
- New user: Tab 1 → Tab 2 → Tab 5 → Tab 4 → Implement fixes
- Quarterly audit: Tab 2 (update Calculator if needed) → Tab 5 if issues found
- Executive presentation: Tab 4 → Show revenue at risk → Request budget
- Comprehensive implementation: Tab 1 → Tab 2 → Tab 3 → Tab 5 (ongoing tracking)
If you need results TODAY: → Go to Tab 2: Quick 30-Min Audit
If you want comprehensive framework: → Go to Tab 3: Full Framework Tracker
If you need to justify the investment: → Go to Tab 4: Revenue Impact Calculator
Tab 1: Calculator with ROI
How the Calculator Feeds Other Tabs
⏱️ Time to complete: 15 minutes for first-time setup, 5 minutes for quarterly updates
Data Flow Overview:
┌─────────────────────────────────────────────────────────────────┐
│  TAB 1: CALCULATOR (You configure this)                         │
├─────────────────────────────────────────────────────────────────┤
│                                                                 │
│  Section 1: Business Metrics                                    │
│  ├─ B5: Cost Per Acquisition (CPA)                              │
│  ├─ B6: Customer Lifetime Value (LTV)                           │
│  ├─ B7: Current Monthly Conversions                             │
│  └─ B8: Current Monthly Ad Spend (auto-calculates)              │
│       ↓                                                         │
│  Section 2: Statistical Precision                               │
│  ├─ B11: Margin of Error (±2% default)                          │
│  ├─ B12: Confidence Level (95% default)                         │
│  ├─ B13: Z-Critical (auto-calculates)                           │
│  └─ B15: Actual Sample Size ← YOU MUST ENTER                    │
│       ↓                                                         │
│  Section 3: Segment Analysis                                    │
│  ├─ Column A: Demographic Segments                              │
│  ├─ Column B: Your TAM % ← YOU MUST ENTER                       │
│  ├─ Column C: Actual Conversions % ← YOU MUST ENTER             │
│  ├─ Column D: Min Sample Size (auto-calculates)                 │
│  └─ Columns E-I: MRI Thresholds (auto-calculate)                │
│       ↓                                                         │
│  Sections 4-7: Cost, ROI, Recommendations (all auto-calculate)  │
│                                                                 │
└─────────────────────────────────────────────────────────────────┘
↓ ↓ ↓
┌─────────────────────────────────────────────────────────────────┐
│  TAB 2: QUICK AUDIT (Auto-populated from Calculator)            │
├─────────────────────────────────────────────────────────────────┤
│  Column A: Segments (from Calculator A20-A24)                   │
│  Column B: TAM % (from Calculator B20-B24)                      │
│  Column C: Actual Conv % (from Calculator C20-C24)              │
│  Column D: Min Sample (from Calculator D20-D24)                 │
│  Column E: Actual Sample (from Calculator B15)                  │
│  Column F: MRI Score (auto-calculates using B and C)            │
│  Columns G-J: MRI Thresholds (from Calculator E-H)              │
│  Column K: Z-Score (auto-calculates)                            │
│  Column L: P-Value (auto-calculates)                            │
│  Column M: Stat Sig? (auto-determines Yes/No)                   │
│  Column N: Status (auto-assigns based on MRI + P-Value)         │
│  Columns O-P: Notes & Date (YOU ADD)                            │
└─────────────────────────────────────────────────────────────────┘
🔑 Key Points:
- You only enter data in Calculator (Tab 1) – specifically Sections 1, 2, and 3
- Quick Audit (Tab 2) auto-populates from Calculator – you don’t enter data there
- Any changes in Calculator immediately update the Quick Audit
- This ensures consistency across your analysis
⚠️ CRITICAL: Any changes to the Calculator tab will automatically update the Quick Audit tab. If you modify TAM %, precision, or actual sample size, the Quick Audit thresholds will recalculate.
Configure your business parameters and statistical precision targets. This tab calculates the dynamic MRI thresholds and minimum sample sizes that auto-populate in the Quick 30-Min Audit tab.
⚠️ IMPORTANT: You MUST complete this tab BEFORE using the Quick 30-Min Audit tab. Follow the instructions below:
Section 1: Your Business Metrics
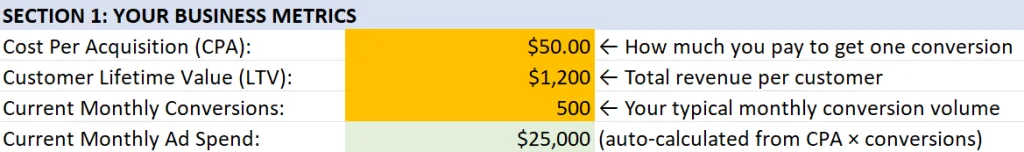
⏱️ Time estimate: 2 minutes to enter 3 values
This section establishes your baseline economics. Here’s what to do:
1. Enter your Cost Per Acquisition (CPA) in Cell B5 – what you pay per conversion
- How much you pay to acquire one conversion (sale, lead, etc)
- Example: $50
- To calculate CPA: Total ad spend ÷ Total conversions
2. Enter your Customer Lifetime Value (LTV) in Cell B6 – revenue per customer
- Revenue per customer (lifetime value or first purchase)
- Example: $1,200
- To Calculate:
- Quick & Dirty: Total revenue ÷ Total customers
- Better: Exclude more recent customers (e.g. Total revenue to date for all customers who made their first purchase at least 12 months ago ÷ Total customers 12 months ago)
- Best: Average Purchase Value x Average Purchase Frequency x Average Customer Lifespan
3. Enter your Current Monthly Conversions in Cell B7 – typical monthly volume
- Your typical monthly conversion volume
- Example: 500 conversions per month
- To calculate: Total conversions over last 3-12 months ÷ total months used in calculation (use last 12 months for seasonal businesses)
- Verify auto-calculated Monthly Ad Spend in Cell B8 – should equal CPA × Conversions – This field auto-computes on the assumption that all of your traffic is paid. After you’re familiar with the process you can adjust this amount manually to consider organic traffic inputs as part of your marketing mix.
- Double-check your numbers – these drive all downstream calculations
- Proceed to Section 2 to set your statistical precision target
Why this matters: These three inputs (CPA, LTV, Monthly Conversions) determine your audit cost, timeline, and ROI calculations throughout the template.
Section 2: Statistical Precision Target
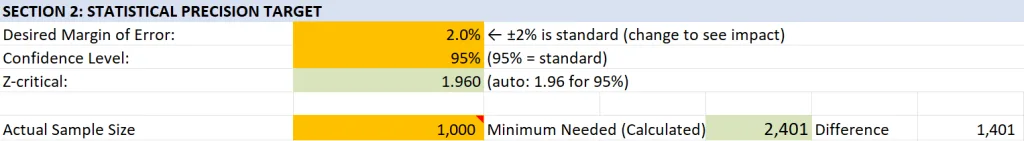
Quick Action Summary
⏱️ Time estimate: 1 minute if leaving defaults, 5 minutes if customizing
This section determines how sensitive your bias detection will be. Here’s what to do:
- Leave Margin of Error at ±2% (Cell B11) unless you’re familiar with statistics
- Leave Confidence Level at 95% (Cell B12) – standard for most business analyses
- DO NOT edit Z-Critical (Cell B13) – auto-calculates from B12
- Enter your Actual Sample Size in Cell B15 – ⚠️ REQUIRED before proceeding
- Proceed to Section 3 to define your demographic segments
Key decision: Only adjust precision (B11) if you need faster results (use ±3% or ±5%) or higher sensitivity (use ±1%). See Section 6 for tradeoff analysis.
Critical: You MUST enter your Actual Sample Size (B15) before the template can calculate minimum sample requirements in Section 3.
If you’re unfamiliar with statistical analysis, then just leave all values unchanged except for “Actual Sample Size.” Otherwise, click here for details.
Desired Margin of Error: (Cell B11)
Leave this unchanged if unfamiliar.
- Default: ±2% (recommended for most businesses)
- This determines how precise your bias detection will be
- Smaller margin = more precision but requires more samples
What This Means:
- ±1%: Very high precision (expensive, ~9,600 samples needed)
- ±2%: High precision (recommended, ~2,400 samples needed)
- ±3%: Moderate precision (faster, ~1,100 samples needed)
- ±5%: Basic precision (cheapest, ~400 samples needed)
Confidence Level: (Cell B12)
Leave this unchanged if unfamiliar.
- Default: 95% (standard, good enough. No need to change but you can try higher levels like 97% or 99%)
- This is the statistical confidence level for all calculations
Z-Critical (auto-calculated) (Cell B13)
Do NOT edit: this is computed based on cell B12.
- Uses normal curve for bias detection based on confidence level (Cell B12)
- Why this matters: Without this value, the statistical significance tests in Tab 2 won’t work.
Actual Sample Size (Cell B15) (REQUIRED)
Adjust this based on the data you have available, as described below.
- Actual number of sample conversions you analyzed for demographic calculations, regardless of recommended minimum sample needed.
- You should ensure this number is at least equal to the “Min Sample Needed” for your demographic segments (see Section 3).
- You MUST enter this value before proceeding to Section 3, below.
Section 3: Segment Analysis with MRI Thresholds
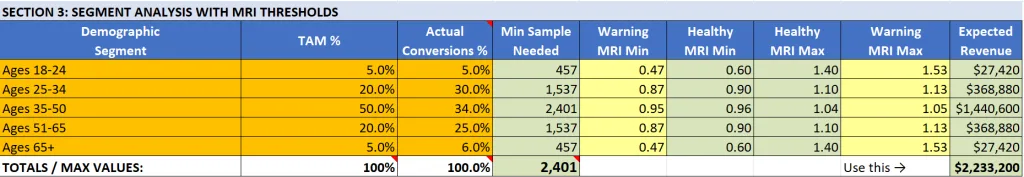
The worksheet is set up for 5 demographic segments. Use the segments defined in cells A20 – A24, or replace them with your own named segments. Stick to 5 segments for your first analysis, to understand how the spreadsheet works. You can customize it after you successfully create your first bias analysis.
Quick Action Summary
This is where you define your target market and enter actual performance data. Here’s what to do:
- Verify your Actual Sample Size is entered in Cell B15 (from Section 2)
- Define your demographic segments in Column A (or keep the default age ranges)
- Enter your TAM % breakdown in Column B, Rows 20-24 (must total 100%)
- Enter your Actual Conversions % in Column C, Rows 20-24 (should total 100%)
- Verify totals = 100% in Row 25 for both Column B and Column C
- Review auto-calculated MRI thresholds in Columns D-I (don’t edit these)
- Proceed to Section 4 to see cost and timeline estimates
Key requirement: Both TAM % (Column B) and Actual Conversions % (Column C) must total 100%. Check Row 25 to verify.
TAM (Total Addressable Market) is the demographic breakdown of your ideal target customer base.
Example: If you sell project management software and your ideal customers are:
- 5% are ages 18-24 (recent grads in small companies)
- 20% are ages 25-34 (individual contributors)
- 50% are ages 35-50 (managers and directors)
- 20% are ages 51-65 (senior leaders)
- 5% are ages 65+ (consultants and advisors)
These percentages = your TAM.
Why it matters: If your actual conversions don’t match your TAM, you have bias. For example, if 35-50 year-olds are 50% of your TAM but only 34% of conversions (as shown in the example data), your algorithms may be excluding this segment.
Here’s how to update the template:
1. Verify your Actual Sample Size is entered in Cell B15 (from Section 2)
Confirm that you updated Cell B15 with the actual number of conversions you’re tracking in your sample data.
2. Define your demographic segments in Column A (or keep the default age ranges)
Column A: Define Your Demographic Segments (Rows 20-24)
The spreadsheet comes pre-populated with 5 age ranges:
- Ages 18-24
- Ages 25-34
- Ages 35-50
- Ages 51-65
- Ages 65+
You can customize these segments to match your business:
- Keep age ranges (default)
- Change to gender (Male, Female, Non-binary, Prefer not to say, Other)
- Change to regions (West Coast, Midwest, South, Northeast, International)
- Change to company size (1-10, 11-50, 51-200, 201-1000, 1000+)
- Change to any other demographic that matters to your business
Best practice for first audit: Stick with 5 segments using the default age ranges to understand how the spreadsheet works. You can customize later.
How to change segments:
- Click on cells A20-A24
- Replace the text with your segment names
- Keep the changes to 5 segments (you can add more rows later)
3. Enter your TAM % breakdown in Column B, Rows 20-24 (must total 100%)
Column B: Enter Your TAM % (Rows 20-24)
What to enter: The percentage of your Total Addressable Market (ideal customers) that falls into each demographic segment.
Format options:
- Enter as decimal:
0.05for 5% - Or enter as percentage:
5%(Excel converts automatically) - Or enter as formula:
=5/100for 5%
Where to get this data:
Option 1: Market Research
- U.S. Census Bureau: https://data.census.gov/
- Pew Research: https://www.pewresearch.org/
- Industry associations (e.g., SaaS benchmarks, retail demographics)
- Your market sizing documentation
Option 2: Business Intelligence
- Your ideal customer profile (ICP) documentation
- Sales team’s target account breakdown
- Historical analysis of your best customers
- Competitive analysis of who competitors target
Option 3: Educated Estimate If you don’t have data, estimate based on:
- Who your product is designed for
- Who gives you testimonials
- Who your sales team targets
- Industry norms for your category
Example entries:
B20: 0.05 or 5%    (Ages 18-24 = 5% of TAM)
B21: 0.20 or 20%   (Ages 25-34 = 20% of TAM)
B22: 0.50 or 50%   (Ages 35-50 = 50% of TAM)
B23: 0.20 or 20%   (Ages 51-65 = 20% of TAM)
B24: 0.05 or 5%    (Ages 65+ = 5% of TAM)
Critical validation: Check Cell B25 – it MUST show 1.00 or 100%
- If B25 ≠ 100%, your percentages don’t add up correctly
- Adjust your entries until B25 = 100%
4. Enter your Actual Conversions % in Column C, Rows 20-24 (should total 100%)
Column C: Enter Your Actual Conversions % (Rows 20-24)
What to enter: The percentage of your actual conversions that came from each demographic segment.
Important: Use your Actual Sample Size from Cell B15 as the denominator.
Example calculation:
- You’re analyzing 1,000 conversions (entered in B15)
- 50 conversions were from Ages 18-24
- Calculation: 50 ÷ 1,000 = 0.05 = 5%
- Enter in C20:
0.05or5%or formula=50/1000
Where to get this data:
Google Ads:
- Reports → Audiences → Demographics
- Select date range matching your sample
- Filter to conversions only
- Export age breakdown
- Calculate percentages
Meta Ads (Facebook/Instagram):
- Ads Manager → Reports
- Breakdown → By Demographics → Age
- Filter to conversions
- Export data
- Calculate percentages
HubSpot:
- Contacts → Analyze Contacts
- Create custom report
- Group by: Age (or demographic field)
- Filter: Lifecycle Stage = Customer
- Export and calculate percentages
Salesforce:
- Reports → Create New Report
- Report Type: Opportunities (Closed Won)
- Group by: Demographics field
- Add filters for date range
- Export and calculate percentages
Google Analytics 4:
- Reports → User Attributes → Demographics
- Add secondary dimension: Conversions
- Filter date range
- Export and calculate percentages
CRM with enrichment (Clearbit, ZoomInfo):
- Export all customers from date range
- Ensure demographic data is populated
- Use pivot table to count by segment
- Calculate percentages
If you don’t have demographic data yet:
- See Troubleshooting section: “I don’t have demographic data”
- Start collecting now, run audit in 30-60 days
- Many platforms can backfill demographics for existing users
Example entries:
C20: 0.05 or 5%    (5% of conversions were Ages 18-24)
C21: 0.30 or 30%   (30% of conversions were Ages 25-34)
C22: 0.34 or 34%   (34% of conversions were Ages 35-50)
C23: 0.25 or 25%   (25% of conversions were Ages 51-65)
C24: 0.06 or 6%    (6% of conversions were Ages 65+)
Critical validation: Check Cell C25 – it SHOULD show 1.00 or 100%
- If C25 ≠ 100%, you may have uncategorized conversions
- Common reasons: “Unknown” demographics, data quality issues
- Acceptable variance: 95-100% (some unknown data is normal)
- If C25 < 95%, check your data source for completeness
Complete Example Side-by-Side:
| Segment | TAM % (B) | Actual % (C) | What This Tells You |
|---|---|---|---|
| Ages 18-24 | 5% | 5% | ✅ Perfect match – no bias detected |
| Ages 25-34 | 20% | 30% | ⚠️ Over-represented – getting 50% more than expected |
| Ages 35-50 | 50% | 34% | 🚨 Under-represented – getting 32% less than expected |
| Ages 51-65 | 20% | 25% | ⚠️ Slightly over-represented |
| Ages 65+ | 5% | 6% | ✅ Close to target – minimal bias |
| TOTAL | 100% | 100% | ✅ Both columns must total 100% |
In this example, you’d investigate why Ages 35-50 (your largest target segment at 50% of TAM) is being under-served at only 34% of conversions. This represents potential bias in your algorithms.
5. Verify totals = 100% in Row 25 for both Column B and Column C
The numbers in each of these columns should total 100%. If not, then adjust until they do.
6. Review auto-calculated MRI thresholds in Columns D-I (don’t edit these)
Columns D-I: Auto-Calculated MRI Thresholds (DO NOT EDIT)
These columns calculate automatically based on your TAM % (Column B) and your precision settings (Section 2). Do not manually edit these cells.
Column D: Min Sample Needed
- Shows minimum conversions needed to detect moderate bias (MRI 0.85) for this segment
- Formula considers segment size and desired precision
- Larger segments need more samples for accurate detection
Column E: Warning MRI Min (99% CI)
- Lower warning threshold (strictest boundary)
- MRI values below this indicate critical under-representation
- Uses 99% confidence interval (more conservative)
Column F: Healthy MRI Min (95% CI)
- Lower healthy threshold (normal boundary)
- MRI values between F and G indicate healthy representation
- Uses 95% confidence interval (standard)
Column G: Healthy MRI Max (95% CI)
- Upper healthy threshold (normal boundary)
- MRI values between F and G indicate healthy representation
- Uses 95% confidence interval (standard)
Column H: Warning MRI Max (99% CI)
- Upper warning threshold (strictest boundary)
- MRI values above this indicate critical over-representation
- Uses 99% confidence interval (more conservative)
Column I: Expected Revenue
- Annual revenue potential for this segment
- Formula: Min Sample Needed × Segment % × Customer LTV
- Helps prioritize which segments matter most financially
Understanding the threshold structure:
Critical Under  Warning Zone  Healthy Range  Warning Zone  Critical Over
  (Too Low)     (Investigate) (Target Zone)  (Investigate) (Too High)
       ↓             ↓             ↓             ↓             ↓
[—————————————|—————————————|—————————————|—————————————|—————————————]
    MRI < E     E ≤ MRI < F   F ≤ MRI ≤ G   G < MRI ≤ H     MRI > H
Why thresholds vary by segment:
Small segments (5% of TAM) have wider acceptable ranges because:
- Smaller sample sizes have more natural variation
- Statistical power is lower for small samples
- Example: 5% segment might have healthy range of 0.60-1.40
Large segments (50% of TAM) have tighter acceptable ranges because:
- Larger sample sizes reduce random variation
- Statistical power is higher for large samples
- Example: 50% segment might have healthy range of 0.96-1.04
This is statistically correct and prevents false alarms from normal variation.
Key Insight: These thresholds are DYNAMIC
The MRI thresholds adapt to each segment’s size:
| Segment Size | Healthy MRI Range | Interpretation |
|---|---|---|
| 5% of TAM | 0.60 – 1.40 | Wide range acceptable |
| 20% of TAM | 0.90 – 1.10 | Moderate range |
| 50% of TAM | 0.96 – 1.04 | Narrow range required |
Why this matters:
- A 5% segment reaching 3% (MRI 0.60) = healthy (within acceptable variation)
- A 50% segment reaching 48% (MRI 0.96) = healthy (minimal deviation)
- A 50% segment reaching 40% (MRI 0.80) = critical bias (large deviation)
The framework adjusts expectations based on statistical reality, not arbitrary fixed thresholds.
🔍 WHY DO MRI THRESHOLDS VARY BY SEGMENT? (Important Concept)
You might notice something counterintuitive:
- 5% TAM segment has healthy range 0.60-1.40 (wide)
- 20% TAM segment has healthy range 0.90-1.10 (moderate)
- 50% TAM segment has healthy range 0.96-1.04 (narrow)
This seems backwards but is statistically correct.
Think of it like throwing darts:
- Small segments (5%) = Small bullseye, hard to hit precisely
- Natural variation is larger
- Acceptable range: ±40% of target
- Example: Hitting 3% when expecting 5% → MRI 0.60 → ✅ Healthy
- Large segments (50%) = Big target, should hit consistently
- Natural variation is smaller
- Acceptable range: ±4% of target
- Example: Hitting 48% when expecting 50% → MRI 0.96 → ✅ Healthy
Why it matters:
- Small segment: 5% target → 3% actual = MRI 0.60 → ✅ Healthy (within expected variation)
- Large segment: 50% target → 40% actual = MRI 0.80 → 🚨 Critical (major problem)
The framework adapts expectations to statistical reality, preventing false alarms from normal variation while catching true bias patterns.
Row 25: Validation Row (CRITICAL CHECK)
Always verify these totals before proceeding:
Cell B25: TAM % Total
- Must equal: 1.00 or 100%
- If not 100%: Adjust your Column B entries
- Why it matters: Invalid TAM breaks all calculations
Cell C25: Actual Conversions % Total
- Should equal: 1.00 or 100%
- Acceptable range: 0.95 – 1.00 (95-100%)
- If less than 95%: Check data completeness – you may have uncategorized conversions
- Why it matters: Missing data invalidates statistical tests
Cell D25: Max Sample Needed
- Shows: Largest Min Sample value from Column D
- This becomes your target sample size (flows to Section 7)
- Why it matters: Determines your audit cost and timeline
Cell I25: Total Expected Revenue
- Shows: Sum of revenue potential across all segments
- Use this for: Executive summaries and budget justification
- Why it matters: Shows total addressable revenue if all segments are properly served
Common Mistakes and How to Avoid Them
❌ Mistake 1: Entering 5 instead of 0.05
- Problem: Spreadsheet interprets 5 as 500%
- Solution: Enter
0.05or5%(with the % symbol) - Verification: Check B25 = 100%
❌ Mistake 2: TAM doesn’t match business reality
- Problem: Using generic demographics instead of your actual ICP
- Solution: Base TAM on actual customer research or business strategy
- Example: Don’t assume 50% are 35-50 just because that’s the population average
❌ Mistake 3: Using outdated demographic data
- Problem: Actual Conversions from 2023, TAM from 2025
- Solution: Match date ranges – both should represent the same period
- Best practice: Use last 90 days for both
❌ Mistake 4: Including non-converting traffic in Column C
- Problem: Using impressions or clicks instead of conversions
- Solution: Only count completed conversions (sales, leads, sign-ups)
- Verification: Numbers should match your sample size in B15
❌ Mistake 5: Not accounting for “Unknown” demographics
- Problem: Column C only totals 87% because 13% are “Unknown”
- Solution: Either exclude unknowns from B15 sample size OR distribute them proportionally
- Best practice: Try to minimize unknowns by enabling demographic tracking
What Happens After You Complete This Section
Once you’ve entered data in Columns B and C and verified Row 25 totals:
- Columns D-I calculate automatically – MRI thresholds and revenue potential
- Section 4 updates – Shows your cost and timeline estimates
- Section 5 calculates – Revenue at risk for different bias scenarios
- Section 6 shows – Precision level tradeoffs
- Section 7 provides – Personalized recommendations
- Tab 2 populates – Quick 30-Min Audit is ready to run with your MRI thresholds
Troubleshooting FAQ
Why does Cell B25 show 0.99 or 1.01, not exactly 1.00
A: Rounding error. As long as it’s 0.99-1.01, you’re fine. If farther off, recheck your percentages.
What if I don’t know my TAM breakdown
Start with industry averages or educated guesses. You can refine later. The goal is to have a baseline to compare against.
What if my actual conversions (Column C) are very different from TAM (Column B)
That’s good! This means you’ve identified bias. The whole point of the audit is to find these gaps. Don’t adjust your TAM to match conversions – that defeats the purpose.
Can I use more than 5 segments?
Yes, but start with 5 first. After you understand the framework, you can copy Row 24 to add more segments. Each additional segment increases sample size requirements. Just check your formulas after modifying the template. You’ll also need to adjust Tab 2: Quick 30-Min Audit to match.
Should I include “Unknown” or “Prefer not to say” as a segment?
No. Exclude unknowns from both TAM and Actual %. They represent data quality issues, not target segments.
My business only serves one age group – can I still use this?
Yes, but use different segments: gender, region, company size, job title, etc. The framework works with any demographic dimension. Just keep in mind that different advertising platforms (Meta, Google, etc.) may have anti-discrimination policies that limit how you segment your ad buys.
Next step: Proceed to Section 4 to review cost and timeline estimates.
Section 4 : Cost & Timeline to Collect Data
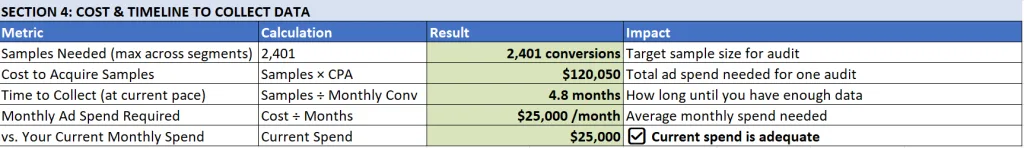
⏱️ Time estimate: 2 minutes to review (nothing to enter)
This section auto-calculates based on your Section 1-3 inputs. Nothing to enter – just review:
Samples Needed (Row 29) – your target data collection goal
- Maximum sample size needed across all segments
- Use this as your target for audits
Cost to Acquire Samples (Row 30) – estimated ad spend required
- Total ad spend needed: Samples × CPA
- Example: 2,401 samples × $50 = $120,050
- Based on the assumption that all traffic is paid. You can manually adjust for organic conversions.
Time to Collect (Row 31) – months needed at current pace
- How long at current pace: Samples ÷ Monthly Conversions
- Example: 2,401 ÷ 500 = 4.8 months
Monthly Ad Spend Required (Row 32) – average monthly investment
- Average monthly spend needed
- Compared to your current spend (Row 33)
Compare to current spend (Row 33) – assess feasibility
The template will tell you if you’re spending enough on advertising to acquire enough samples for your marketing bias audit. Just read the output in Cell E33.
Action: If timeline > 6 months, return to Section 2 and lower precision from ±2% to ±3%, then proceed to Section 5 to understand the tradeoffs.
Section 5: Revenue Impact of Missing Bias
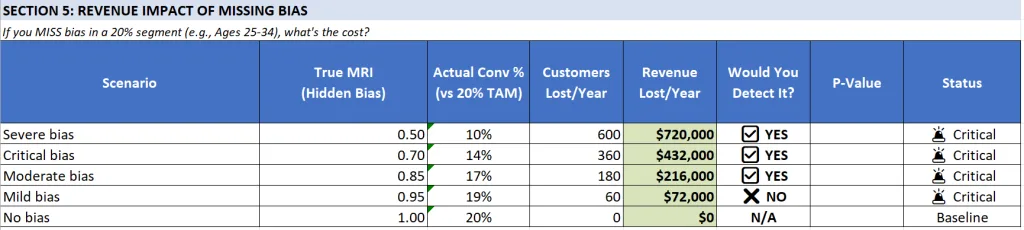
Quick Action Summary
⏱️ Time estimate: 3 minutes to review (nothing to enter)
This section shows what you’ll lose by missing bias patterns. Nothing to enter – just review:
- Review the scenario table – shows revenue lost at different bias severity levels
- Check “Would You Detect It?” column – confirms whether your sample size catches each level
- Note the largest risk – typically moderate bias (MRI 0.85) costing $200K+ annually
- Use this for budget justification – show leadership what’s at stake
Key insight: Even if you can only detect severe bias (MRI < 0.70), you’re still protecting against major revenue loss. Use these numbers in executive presentations.
Shows real scenarios: What happens if you MISS bias in a 20% segment?
Example scenarios shown:
- Severe bias (MRI 0.50): Lose $720,000/year
- Critical bias (MRI 0.70): Lose $432,000/year
- Moderate bias (MRI 0.85): Lose $216,000/year
- Mild bias (MRI 0.95): Lose $72,000/year
Key Question: “Would You Detect It?” column shows whether your sample size will catch each level of bias.
Section 6: Compare Precision Levels (Cost vs Sensitivity)
This section helps you choose the right balance between precision, cost, and timeline by showing tradeoffs across four precision levels. All calculations are based on your business metrics entered in Section 1.
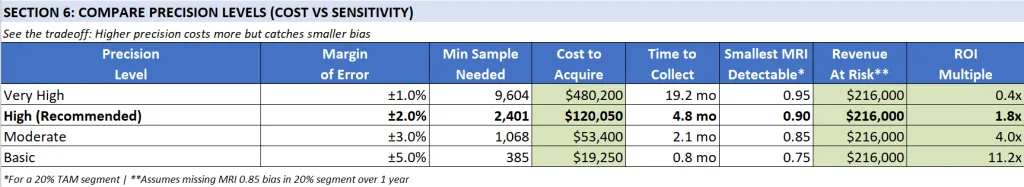
Quick Action Summary
This section shows you the cost-benefit tradeoff of four precision levels. Here’s what to do:
- Review the comparison table below – See cost, time, and ROI for each precision level
- Check “Smallest MRI Detectable” – Understand what level of bias each precision catches
- Note “Revenue At Risk” – See what you’d lose annually if you miss moderate bias ($216K in example)
- Compare ROI Multiple – Higher ROI isn’t always better (may miss smaller biases)
- Use the decision framework – Choose your precision level based on budget, timeline, and risk tolerance
- Cross-reference with Section 5 – Verify your chosen precision catches the bias levels you care about
- Proceed to Section 7 – See personalized recommendations for your business
Default recommendation: Start with High Precision (±2%) unless budget or timeline requires adjustment.
Understanding the Comparison Table
The table shows 8 columns comparing four precision levels:
| Column | What It Measures | How to Interpret |
|---|---|---|
| Precision Level | Quality tier of your bias detection | Higher precision catches smaller biases but costs more |
| Margin of Error (MOE) | Statistical precision (±%) | Smaller = more precise detection, requires more samples |
| Min Sample Needed | Conversions required | Formula: 1.96² × 0.5 × 0.5 / MOE² |
| Cost to Acquire | Total ad spend needed (assuming all traffic is paid and not organic) | Sample Size × Your CPA (from Section 1) |
| Time to Collect | Months to gather samples | Sample Size ÷ Your Monthly Conversions |
| Smallest MRI Detectable* | Minimum bias detectable | Calculated as: (0.2 – MOE) / 0.2 for a 20% segment |
| Revenue At Risk** | Annual revenue loss if bias missed | Based on MRI 0.85 scenario in 20% segment over 1 year |
| ROI Multiple | Return on investment | Revenue At Risk ÷ Cost to Acquire |
Complete Comparison (Example with CPA=$50, LTV=$1,200, Monthly Conversions=500)
| Precision Level | Margin of Error | Min Sample Needed | Cost to Acquire | Time to Collect | Smallest MRI Detectable* | Revenue At Risk** | ROI Multiple |
|---|---|---|---|---|---|---|---|
| Very High | ±1% | 9,604 | $480,200 | 19 months | 0.95 | $216,000 | 0.4x ❌ |
| High (Recommended) | ±2% | 2,401 | $120,050 | 5 months | 0.90 | $216,000 | 1.8x ✅ |
| Moderate | ±3% | 1,068 | $53,400 | 2 months | 0.85 | $216,000 | 4.0x 💰 |
| Basic | ±5% | 385 | $19,250 | 1 month | 0.75 | $216,000 | 11.2x 🤔 |
Understanding Key Concepts
What is “Smallest MRI Detectable”?
This shows the smallest Market Representation Index (MRI) deviation you can reliably detect with each precision level. Using a 20% TAM segment as the example:
- Very High (±1%): Catches MRI 0.95 = reaching 19% instead of 20% (1% gap)
- High (±2%): Catches MRI 0.90 = reaching 18% instead of 20% (2% gap)
- Moderate (±3%): Catches MRI 0.85 = reaching 17% instead of 20% (3% gap)
- Basic (±5%): Catches MRI 0.75 = reaching 15% instead of 20% (5% gap)
Why is “Revenue At Risk” the same ($216,000) for all precision levels?
This represents a standardized scenario: What revenue would you lose annually if you fail to detect moderate bias (MRI 0.85) in a 20% segment?
The calculation:
Revenue At Risk = (Expected % - Actual %) × Annual Conversions × Customer LTV
                = (20% - 17%) × (500 × 12) × $1,200
                = 3% × 6,000 × $1,200
                = 180 customers lost × $1,200
                = $216,000 per year
The revenue at risk is constant because we’re asking the same question for each row: “If moderate bias exists, what does it cost you?”
The key difference is whether each precision level can actually detect this bias:
- ✅ High, Moderate, and Basic can all detect MRI 0.85 (these catch bias of 0.90, 0.85, and 0.75 respectively)
- ❌ Very High can only reliably detect MRI 0.95 or worse (it would miss MRI 0.85)
Understanding ROI Multiple:
The ROI Multiple shows your return on investment: Revenue At Risk ÷ Cost to Acquire
- Very High (0.4x): Lose money – costs $480K to save $216K
- High (1.8x): Good return – spend $120K to save $216K = 80% net profit
- Moderate (4.0x): Strong return – spend $53K to save $216K = 300% net profit
- Basic (11.2x): Excellent return – spend $19K to save $216K = 1000% net profit
However: Higher ROI isn’t always better because:
- Basic (11.2x ROI) can only detect severe bias (MRI 0.75) – you’ll miss moderate bias
- Moderate (4.0x ROI) can barely detect moderate bias (MRI 0.85) – on the edge
- High (1.8x ROI) reliably catches meaningful bias (MRI 0.90) – recommended sweet spot
The Core Tradeoff
The Precision Paradox:
- Lower precision = Cheaper, faster, higher ROI, but misses smaller biases
- Higher precision = Expensive, slower, lower ROI, but catches everything
Real-World Impact:
Imagine you have moderate bias (MRI 0.85) in your 25-34 age segment:
| You Choose | Can You Detect It? | What Happens |
|---|---|---|
| Very High (±1%) | ❌ NO | Spend $480K over 19 months, miss the bias, lose $216K/year |
| High (±2%) | ✅ YES | Spend $120K over 5 months, catch it, save $216K/year |
| Moderate (±3%) | ✅ YES (barely) | Spend $53K over 2 months, catch it, save $216K/year |
| Basic (±5%) | ❌ NO | Spend $19K over 1 month, miss the bias, lose $216K/year |
Decision Framework: How to Choose Your Precision Level
Step 1: Identify Your Business Context
If you’re a startup or small business (ad budget < $50K/month):
- Start with Moderate (±3%) or Basic (±5%)
- Lower cost and faster results prove value quickly
- Risk: May miss smaller biases, but you’ll catch severe ones
If you’re an established business (ad budget $50K-$200K/month):
- Use High (±2%) [RECOMMENDED]
- Best balance of cost, time, and detection capability
- Catches meaningful bias without breaking the budget
If you’re enterprise (ad budget > $200K/month) or have compliance requirements:
- Consider Very High (±1%) only if you need it for compliance
- Or stick with High (±2%) – usually sufficient even for large companies
Step 2: Check Section 5 “Would You Detect It?”
Cross-reference your chosen precision with Section 5 to see which bias levels you’d catch:
- If you can’t detect MRI 0.85, you might miss moderate bias costing $216K/year
- If you can only detect MRI 0.70 or worse, you’re only catching critical bias
Step 3: Consider Your Timeline
| If You Need Results… | Choose This |
|---|---|
| Within 1 month | Basic (±5%) – Fast but misses moderate bias |
| Within 2-3 months | Moderate (±3%) – Good balance for quick insights |
| Within 4-6 months | High (±2%) – Recommended for thoroughness |
| No rush / Compliance-driven | Very High (±1%) – Maximum precision |
Step 4: Evaluate Cost vs. Risk
Ask yourself: “What’s more expensive – the audit cost or the revenue we’re losing to bias?”
Example calculations using the table above:
- Moderate bias (MRI 0.85) in a 20% segment = $216K/year lost
- High precision audit costs $120K = Still saves $96K/year (1.8x ROI)
- Moderate precision audit costs $53K = Saves $163K/year (4.0x ROI)
Unless you’re certain you don’t have bias, the audit is almost always worth it.
Step 5: Make Your Decision
IF budget > $100K AND timeline is flexible (4-6 months):
  → Choose "High Precision (±2%)" - Best overall balance ✅

ELSE IF budget is tight OR need fast results:
  → Choose "Moderate Precision (±3%)" - 4x ROI, 2 months 💰

ELSE IF only concerned about severe bias OR testing the waters:
  → Choose "Basic Precision (±5%)" - 11x ROI, 1 month 🤔
  → BUT understand you might miss moderate bias

ELSE IF compliance requirements OR very high stakes:
  → Choose "Very High Precision (±1%)" - But expect negative ROI ⚠️
Recommended Action
For most businesses, we recommend starting with High Precision (±2%):
- Catches meaningful bias (MRI 0.90 and below)
- Positive ROI (1.8x)
- Reasonable timeline (4-6 months)
- Doesn’t require massive ad budget increase
You can always:
- Start with one channel to prove value, then expand
- Lower precision to Moderate if budget is tight
- Increase precision to Very High if you discover critical issues
Section 7: Recommendations for Your Business (Fully Automated)
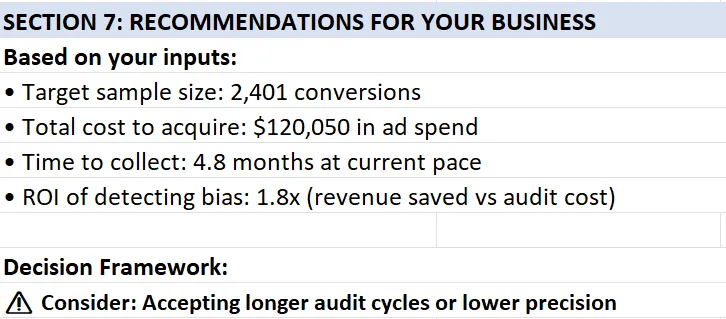
Quick Action Summary
This section translates your inputs into specific recommendations. Here’s what to review:
- Read your target sample size – How many conversions you need (Row 55)
- Check total cost to acquire – Your audit budget in ad spend (Row 56)
- Review time to collect – How long this takes at current pace (Row 57)
- Note your ROI – Return on investment for the audit (Row 58)
- Read the decision framework – Specific guidance based on your timeline (Row 61)
- Choose your path:
- ✅ Time ≤ 3 months → Proceed to Tab 2 immediately
- ⚠️ Time 3-6 months → Adjust precision in Section 2 OR accept semi-annual audits
- ❌ Time > 6 months → Return to Section 2, lower precision from ±2% to ±3% or ±5%
- Proceed to Tab 2: Quick 30-Min Audit once your approach is confirmed
Key decision: If you can’t complete the audit in your desired timeframe, adjust precision (Cell B11) and re-check this section.
What Each Line Means
The recommendations appear as a bulleted list with 4 key metrics plus a decision framework:
Line 1: “Target sample size: [X] conversions”
- What it shows: The total number of conversions you need to collect for your audit
- How it’s calculated:
MAX(Column D, Rows 20-24)– Takes the largest “Min Sample Needed” across all your demographic segments - Example: If your segments need 457, 1,537, 2,401, 1,537, and 457 samples respectively, this shows 2,401
- Why it matters: This is your data collection goal – you need this many conversions WITH demographic breakdowns to run a statistically valid audit
- Action: This becomes your target for data extraction from your ad platforms/CRM
Line 2: “Total cost to acquire: $[X] in ad spend”
- What it shows: The estimated advertising cost to generate your target sample size
- How it’s calculated:
Target Sample Size × Your CPA (Cell B5) - Example: 2,401 samples × $50 CPA = $120,050
- Why it matters: This is your audit budget – what you’ll invest to collect enough data for analysis
- Important caveat: This assumes 100% paid traffic. If you have organic traffic, actual cost will be lower
- Adjustment: If you’re 60% paid / 40% organic: Actual cost ≈ 0.60 × $120,050 = $72,030
- Action: Use this to request budget approval or determine if you should lower precision
Line 3: “Time to collect: [X] months at current pace”
- What it shows: How long it will take to gather your target sample size at your current conversion rate
- How it’s calculated:
Target Sample Size ÷ Your Monthly Conversions (Cell B7) - Example: 2,401 samples ÷ 500 monthly conversions = 4.8 months
- Why it matters: This tells you if quarterly audits are feasible or if you need to adjust your approach
- Threshold interpretation:
- ≤ 3 months: Excellent – you can run quarterly audits
- 3-6 months: Good – you can run semi-annual audits
- 6-12 months: Challenging – consider lower precision or annual audits only
- > 12 months: Problematic – definitely lower precision or increase ad spend
- Action: Compare this to your desired audit frequency (quarterly is recommended)
Line 4: “ROI of detecting bias: [X] x (revenue saved vs audit cost)”
- What it shows: The return on investment if you successfully detect and fix moderate bias
- How it’s calculated:
Revenue At Risk ÷ Cost to Acquire (Cell H48) - Why it matters: This is your business case for leadership – quantifies the value of the audit
- Interpretation:
- > 5x ROI: Compelling case – every $1 spent returns $5+
- 2-5x ROI: Strong case – profitable investment
- 1-2x ROI: Moderate case – breaks even with some additional profit
- < 1x ROI: Weak case – costs more than it saves (only choose if compliance-driven)
- Action: Use this number in budget requests and stakeholder presentations
Line 5: Decision Framework
This line provides a dynamic recommendation based on your specific numbers. It branches into two possible messages:
Scenario A: Time to Collect ≤ 3 months
✅ You can complete an audit quarterly (ideal frequency)
- What it means: Your current conversion volume is high enough to run audits every quarter
- Why quarterly is ideal:
- Bias can develop within 3-6 months as algorithms retrain
- Quarterly matches typical business planning cycles
- Allows you to catch and fix issues before they compound
- Action:
- Schedule recurring bias audits in your calendar (Q1, Q2, Q3, Q4)
- Assign ownership to Marketing Ops or Data team
- Make it a standing agenda item in leadership reviews
- Proceed immediately to Tab 2: Quick 30-Min Audit
Scenario B: Time to Collect > 3 months
The system evaluates whether increasing ad spend would help, then provides targeted advice:
B1: If Monthly Required Spend / Current Spend > 1.5 (significant increase needed)
⚠️ Consider: Increasing ad spend to $[X]/mo
- What it means: You’d need to significantly increase ad spending (50%+ more) to achieve quarterly audits
- The calculation:
- Current monthly spend: $25,000 (example from Cell B8)
- Required monthly spend: $40,000 (example from Cell C32)
- Ratio: 40,000 / 25,000 = 1.6 (> 1.5 threshold, so this message appears)
- Your options:
- Increase ad budget to suggested amount (if growth budget available)
- Lower precision target in Section 2 (e.g., from ±2% to ±3% cuts samples needed by 55%)
- Accept longer audit cycles (semi-annual instead of quarterly)
- Mix paid + organic data if you have significant organic traffic
- Action: Present business case to CFO/CMO with Section 6 ROI numbers
B2: If Monthly Required Spend / Current Spend ≤ 1.5 (moderate increase)
⚠️ Consider: Accepting longer audit cycles or lower precision
- What it means: You’re close to quarterly capability but not quite there – small adjustments could work
- Why this appears: Your required spend is within 50% of current (e.g., need $30K, spending $25K)
- Your options:
- Accept semi-annual audits (6 months) instead of quarterly (3 months)
- Lower precision from ±2% to ±3% (reduces samples by ~55%, might enable quarterly)
- Run pilot audit on ONE channel first to prove value, then request budget increase
- Action: Weigh the tradeoff – is quarterly auditing worth a 20-30% budget increase?
Complete Interpretation Guide
Understanding the Full Picture:
The four metrics work together to tell a story about your audit feasibility:
Sample Size (2,401) + Cost ($120K) + Time (4.8 mo) + ROI (1.8x) → Decision
GREAT Scenario
- Time ≤ 3 months ✅
- ROI > 3x 💰
- Interpretation: You’re in an ideal position – proceed immediately with quarterly audits
- Action: Execute the audit, schedule recurring reviews, evangelize results
GOOD Scenario
- Time 3-6 months ⚠️
- ROI 1.5-3x ✅
- Interpretation: Viable but requires minor adjustments
- Action: Choose one:
- Lower precision from ±2% to ±3% (cuts time to ~2 months)
- Accept semi-annual audits instead of quarterly
- Both options maintain positive ROI
CHALLENGING Scenario
- Time 6-12 months ❌
- ROI < 1.5x or Cost is very high ⚠️
- Interpretation: Requires strategic choices
- Action: Choose one:
- Option 1: Start with Basic precision (±5%) – 1 month, 11.2x ROI, proves value quickly
- Option 2: Increase ad budget significantly (show Section 6 ROI to justify)
- Option 3: Audit ONE high-priority channel first, use results to justify full audit
- Option 4: Use existing historical data if you have 1,000+ conversions with demographics
PROBLEMATIC Scenario
- Time > 12 months 🚫
- Cost exceeds annual marketing budget 💸
- Interpretation: Current approach isn’t feasible
- Action: Fundamental reassessment needed:
- Are your demographic segments too granular? (Consider consolidating)
- Do you have historical data you can use immediately?
- Should you start with just 3 segments instead of 5?
- Is your business large enough for statistical bias detection? (May need manual review instead)
How to Use These Recommendations in Practice
For Budget Approval
“Our audit will cost $120K in ad spend over 5 months. We expect to detect bias costing us $216K annually in lost revenue. That’s a 1.8x ROI in year one, and ongoing savings in future years. The audit pays for itself.”
For Timeline Planning
“We need 4.8 months to collect sufficient data. I recommend starting the audit in Q1 so results are ready for Q2 planning. This becomes a quarterly process going forward.”
For Stakeholder Concerns
“Why do we need this?” → “We’re potentially losing $216K/year to algorithmic bias. This $120K audit identifies and fixes it.”
“Can’t we do this cheaper?” → “Yes – we can lower precision from ±2% to ±3%, which cuts cost to $53K and time to 2 months. Tradeoff: we might miss smaller biases, but we’ll definitely catch the big ones.”
“Why quarterly?” → “Algorithms retrain every 3-6 months. Quarterly audits catch bias before it compounds. It’s like technical debt – cheaper to catch early.”
Common Questions & Answers
What if my time to collect is 8 months but I need quarterly audits?
You have three options:
- Reduce precision from ±2% to ±3% (cuts samples needed by ~55%, time drops to ~3.6 months)
- Increase ad spend by ~60% to accelerate data collection (show ROI numbers to justify)
- Use existing data – if you have 1,000+ historical conversions with demographic breakdowns, you can audit immediately
Can I use historical data instead of collecting new data?
Yes! If you have 1,000+ past conversions with demographic data (from Google Ads, Meta Ads, CRM, etc.), you can run your first audit immediately. The “time to collect” only matters if you’re starting from scratch. Historical data is actually ideal because it shows your real-world bias patterns.
Should I always aim for the highest ROI?
No. While “Basic” precision (±5%) shows 11.2x ROI, it only catches severe bias (MRI < 0.75). You’d miss moderate bias (MRI 0.85) that costs $216K/year. The “High” precision (±2%) at 1.8x ROI is recommended because it catches meaningful bias while remaining cost-effective. Don’t optimize for ROI if it means missing the problem.
What if leadership won’t approve the budget?
Use this three-step approach:
- Start smaller: Audit just ONE high-spend channel with “Moderate” precision (±3%) – costs ~$53K, 2 months, 4x ROI
- Show results: Use the findings to quantify actual bias in that channel
- Expand: Use proven results to justify full multi-channel audit with “High” precision
What if our recommendation says to increase ad spend to $40K/month, and it’s not realistic?
Don’t increase spend just for the audit. Instead:
- Lower precision target in Section 2 (Cell B11) from ±2% to ±3%
- This cuts required samples by ~55%
- Your monthly spend requirement drops proportionally
- Re-check Section 7 to see new recommendations
What if we have significant organic traffic?
The “Total cost to acquire” assumes 100% paid traffic. Adjust it manually:
- If you’re 70% paid / 30% organic: Actual cost ≈ 0.70 × Listed Cost
- Example: $120K listed cost × 0.70 = $84K actual cost for paid + organic mix
- This improves your ROI proportionally
- Time to collect remains accurate (it’s based on total conversions regardless of source)
Key Takeaway
Sections 6 and 7 work together to answer three critical questions:
- Section 6: “What precision level should I choose?” (Balance cost, time, and detection capability)
- Section 7: “Is this feasible for my business?” (Can I afford it, do I have time, what’s the ROI?)
- Combined: “What specific actions should I take next?” (Execute, adjust, or reassess)
The goal isn’t perfection – it’s finding the right balance between statistical rigor and business practicality. Most businesses should start with “High” precision (±2%) and adjust based on results.
⚠️ CRITICAL: Any changes to the Calculator tab will automatically update the Quick Audit tab. If you modify TAM % or precision, the Quick Audit thresholds will recalculate.
Real-World Example: Complete Audit Walkthrough
Background: B2B SaaS Company
Company Profile:
- Industry: Project management software
- Monthly ad spend: $100,000
- Monthly conversions: 500
- Average Customer LTV: $1,200
- Target Market: 50% ages 35-50 (managers and directors)
The Problem:
Marketing team noticed declining ROI from their Google Performance Max campaigns but couldn’t identify why. They suspected their algorithms might be missing key segments.
Step 1: Data Collection (15 minutes)
What they did:
- Exported last 1,000 conversions from Google Ads → Reports → Audiences → Demographics
- Downloaded CSV showing age breakdown of converters
- Referenced their ideal customer profile (ICP) research for TAM
Their TAM breakdown (based on market research):
- Ages 18-24: 5% (recent grads in small companies)
- Ages 25-34: 20% (individual contributors)
- Ages 35-50: 50% (managers/directors—their sweet spot)
- Ages 51-65: 20% (senior leaders)
- Ages 65+: 5% (consultants and advisors)
Their actual conversion data (1,000 conversions):
- Ages 18-24: 50 conversions (5.0%)
- Ages 25-34: 300 conversions (30.0%)
- Ages 35-50: 340 conversions (34.0%)
- Ages 51-65: 250 conversions (25.0%)
- Ages 65+: 60 conversions (6.0%)
Step 2: Configure Calculator (5 minutes)
What they entered in Tab 1:
Section 1: Business Metrics
- B5 (CPA): $200
- B6 (LTV): $1,200
- B7 (Monthly Conversions): 500
- B8 (Monthly Ad Spend): Auto-calculated to $100,000 ✓
Section 2: Precision Target
- B11 (Margin of Error): ±2% (default)
- B12 (Confidence Level): 95% (default)
- B15 (Actual Sample Size): 1,000
Section 3: Segment Analysis
- Column B (TAM %): 5%, 20%, 50%, 20%, 5%
- Column C (Actual %): 5%, 30%, 34%, 25%, 6%
Totals verified:
- B25: 100% ✓
- C25: 100% ✓
Step 3: Review Auto-Calculated Results (Tab 2)
The Quick Audit tab immediately revealed:
| Segment | TAM % | Actual % | MRI | P-Value | Status |
|---|---|---|---|---|---|
| 18-24 | 5% | 5.0% | 1.00 | 0.99 | ✅ Healthy |
| 25-34 | 20% | 30.0% | 1.50 | <0.001 | 🚨 Critical (over) |
| 35-50 | 50% | 34.0% | 0.68 | <0.001 | 🚨 Critical (under) |
| 51-65 | 20% | 25.0% | 1.25 | 0.03 | ⚠️ Warning (over) |
| 65+ | 5% | 6.0% | 1.20 | 0.51 | ✅ Healthy |
Key Finding: Ages 35-50 (their LARGEST target market at 50% of TAM) showed critical under-representation:
- MRI 0.68 = Reaching only 68% of expected volume
- P-value < 0.001 = 99.9%+ confidence this is real bias, not chance
- Status: 🚨 Critical—immediate action required
Step 4: Calculate Revenue Impact (5 minutes)
Using Tab 4 (Revenue Impact Calculator):
The Gap:
- Expected: 50% of 1,000 = 500 conversions from ages 35-50
- Actual: 34% of 1,000 = 340 conversions
- Missing: 160 conversions per 1,000
Quarterly Impact:
- Sample represents 2 months (1,000 conversions ÷ 500/month)
- Missing conversions per quarter: 160 × 1.5 = 240
- Lost revenue per quarter: 240 × $1,200 = $288,000
Annual Impact:
- 4 quarters × $288,000 = $1,152,000 per year at risk
Step 5: Root Cause Investigation (30 minutes)
They documented in Tab 5 (Bias Pattern Log):
Identified Issues:
- Automation Bias: Performance Max was never questioned—assumed “Google knows best”
- Data Representation Bias: Training data skewed to early adopters (younger demographic)
- Confirmation Bias Loop: Young converters → algorithm targets more young people → reinforces pattern
Specific Findings:
- Google Performance Max trained on first 6 months of conversions (beta testers, early adopters)
- Early customers skewed 70% ages 25-34
- Lookalike audiences built from this biased base
- No manual audience signals added to correct drift
- Creative and messaging appealed to “fast movers” (younger demographic)
Step 6: Implementation of Fixes (2 hours)
Following the article’s “Four Bias Amplifiers” section, they implemented:
Fix 1: Data Rebalancing (1 hour)
- Manually added audience signals to Performance Max:
- Job titles: “Director,” “VP,” “Senior Manager”
- Company sizes: 200-1000 employees
- Industries with older decision-makers
- Created seed list of ages 35-50 converters for lookalike expansion
Fix 2: Campaign Segmentation (30 minutes)
- Created separate campaign explicitly targeting ages 35-50
- Budget: 20% of total ($20K/month) to force exploration
- Custom ad copy emphasizing “proven,” “established,” “reliable”
Fix 3: Monitoring Setup (30 minutes)
- Created dashboard widget showing age distribution weekly
- Set alert: If ages 35-50 drops below 45%, investigate immediately
- Added “Market Coverage %” to executive KPI dashboard
Step 7: Results After 90 Days
New Audit Results (next 1,500 conversions):
| Segment | TAM % | New Actual % | New MRI | P-Value | Status |
|---|---|---|---|---|---|
| 18-24 | 5% | 4.8% | 0.96 | 0.73 | ✅ Healthy |
| 25-34 | 20% | 22.0% | 1.10 | 0.18 | ✅ Healthy |
| 35-50 | 50% | 47.0% | 0.94 | 0.08 | ✅ Healthy |
| 51-65 | 20% | 21.5% | 1.08 | 0.41 | ✅ Healthy |
| 65+ | 5% | 4.7% | 0.94 | 0.65 | ✅ Healthy |
Business Impact:
- Ages 35-50 representation: 34% → 47% (+13 percentage points)
- MRI improved: 0.68 → 0.94 (now in healthy range)
- Statistical significance: p < 0.001 → p = 0.08 (no longer significant deviation)
- Additional conversions captured: ~195 in 90 days
- Revenue impact: 195 × $1,200 = $234,000 in one quarter
- Annualized: $936,000 (81% of total revenue at risk)
Cost Analysis:
- Implementation time: 2 hours (internal)
- Ongoing monitoring: 15 minutes weekly
- Additional ad spend: $0 (reallocation, not increase)
- Total investment: ~$500 (labor cost)
- ROI: 1,872x in first year
Key Lessons
What Worked:
- ✅ Statistical validation (z-test) confirmed real bias vs. random variation
- ✅ Quick diagnostic (30 minutes) identified $1M+ revenue opportunity
- ✅ Data rebalancing was fastest, highest-impact fix
- ✅ Ongoing monitoring prevented recurrence
What Surprised Them:
- Their “best performing” campaign (Performance Max) was their biggest bias source
- The segment they were designed to serve (managers 35-50) was most excluded
- Fixing bias improved overall performance—didn’t sacrifice efficiency for diversity
- Competitors likely have same blind spot (competitive advantage)
Ongoing Practice:
- Quarterly audits now standard (calendar reminder set)
- Market Coverage % added to executive dashboard
- Bias review included in campaign retrospectives
- Team trained to question “what the algorithm recommends”
Tab 2: Quick 30-Min Audit
Quick Action Summary
⏱️ Time estimate: 30 minutes if Calculator is complete, 2 hours if starting from scratch
This tab provides your fastest path to identifying bias. Here’s the workflow:
- ✅ Verify prerequisites – Ensure Tab 1 Calculator is 100% complete first
- 👀 Check auto-populated data – All columns should show values from Calculator
- 🔍 Review MRI scores (Column F) – identify segments with scores < 0.85 or > 1.15
- 📊 Check statistical significance (Column M) – only act on “Yes” entries
- 🚦 Review Status (Column N) – focus on 🚨 Critical and ⚠️ Warning segments
- 📝 Document findings (Columns O-P) – add notes and date stamp
- ➡️ Proceed to Tab 5 if you found bias patterns (to log and track fixes)
Critical rule: Only take action on segments where BOTH conditions are true:
- MRI is outside healthy range (Columns H-I), AND
- P-Value < 0.05 (Column M shows “Yes”)
Purpose Quickly identify if your marketing automation has bias issues and which segments are affected.
⚠️ PREREQUISITE: You MUST complete Tab 1: Calculator with ROI BEFORE using this tab, including:
- Business metrics (B5-B7): CPA, LTV, Monthly Conversions
- Statistical precision (B11-B12): Margin of error and confidence level
- Actual Sample Size (B15): Total conversions analyzed ⚠️ REQUIRED
- TAM % (Column B, Rows 20-24): Your target market breakdown
- Actual Conversions % (Column C, Rows 20-24): Your actual performance ⚠️ REQUIRED
👉 Return to Calculator instructions if you haven’t completed these steps.
The calculator auto-populates the MRI thresholds and minimum sample sizes used in this tab. All values in Tab 2 flow automatically from Tab 1 – you do not enter data directly in Tab 1.
How to Use
⚠️ IMPORTANT: All data in Tab 1 auto-populates from the Calculator tab. Do not manually edit columns B, C, D, or E in this tab. If you need to change values, go back to Calculator tab.
Step 1: Verify all auto-populated INPUTS:
Before reviewing outputs, confirm that all inputs from the previous tab (Calculator with ROI) are correct:
Column A: Demographic segments (from Calculator A20-A24)
If any of the demographic labels (e.g. age ranges) need to be adjusted, then change them on the “Calculator with ROI” tab, and the values will be updated automatically on this tab.
Column B: TAM % (from Calculator B20-B24)
- Auto-populates from Calculator tab Column B (Rows 20-24)
- Should match your target market breakdown
- If incorrect, update in Calculator tab (not here)
Column C: Actual Conversions % (from Calculator C20-C24)
- Auto-populates from Calculator tab Column C (Rows 20-24)
- Should show your actual conversion performance by demographic
- If incorrect, update in Calculator tab (not here)
- Total should equal 100%
Column D: Min Sample Size Needed (from Calculator D20-D24)
- Auto-populates from Calculator tab Column D
- Shows minimum samples needed to detect moderate bias (MRI 0.85)
Column E: Actual Sample Size (from Calculator B15)
- Auto-populates from Calculator tab Cell B15
- Shows the same value for all rows (this is correct)
- If incorrect, update Calculator tab B15 (not here)
If any columns are blank or show #REF errors:
- Return to Tab 1 (Calculator)
- Verify you entered data in B15, Column B, and Column C
- Refresh this tab (F9 in Excel, or close/reopen in Google Sheets)
- These values are auto-populated from the Calculator tab
- Should match the TAM % you entered in Calculator (Column B, Rows 20-24)
- DO NOT manually edit these values—change them in the Calculator tab instead
- Ensure total = 100%
Note: If you need to change demographic segments, do it in the Calculator tab and the changes will flow here automatically.
Example
- Ages 18-24: 15%
- Ages 25-34: 30%
- Ages 35-50: 35%
- Ages 51-65: 15%
- Ages 65+: 5%
The spreadsheet is already populated with these age ranges as segments. Replace them with whatever you want (age, gender, etc. or combinations thereof). It’s intentionally simplistic.
Resources for TAM data
- U.S. Census Bureau
- Pew Research
- Industry associations
- Your market sizing documentation
Where to find conversion data (for entering in Calculator tab Column C):
- Google Ads: Reports → Audience → Demographics
- Meta Ads: Ads Manager → Reports → Demographics
- HubSpot: Contacts → Analyze → Create Custom Report
- Salesforce: Reports → Create New Report → Opportunities by Demographics
Step 2: Review Auto-Calculated OUTPUTS
The template automatically calculates and compares your performance against dynamic thresholds:
Columns D & E: Min Sample Size Needed
- Auto-populated from Calculator tab
- Shows samples needed to detect MRI 0.85 with 80% statistical power
- Compare this to Column E (your actual sample size)
- If Column E < Column D: You may miss moderate bias (MRI 0.85-1.00)
- If Column E ≥ Column D: You have adequate power to detect meaningful bias
Column F: MRI Score (Market Representation Index)
- Formula: (Actual Conversions %) ÷ (TAM %)
- Auto-calculated from your data in Columns B and C
- Interpretation:
- MRI = 1.00: Perfect alignment (actual matches target exactly)
- MRI < 1.00: Under-represented (getting fewer conversions than expected)
- MRI > 1.00: Over-represented (getting more conversions than expected)
Columns G-J: Dynamic MRI Thresholds
- Auto-populated from Calculator tab based on your TAM % and precision settings
- These adapt to each segment’s size (not fixed values like 0.85-1.15)
Column G: Warning MRI Min (99% CI)
- Values below this are critically under-represented
Column H: Healthy MRI Min (95% CI)
- Lower bound of acceptable range
- MRI between H and I = Healthy (if statistically significant)
Column I: Healthy MRI Max (95% CI)
- Upper bound of acceptable range
- MRI between H and I = Healthy (if statistically significant)
Column J: Warning MRI Max (99% CI)
- Values above this are critically over-represented
Example Thresholds (vary by segment):
- 5% TAM segment: Healthy range 0.60-1.40 (wide range)
- 20% TAM segment: Healthy range 0.90-1.10 (moderate)
- 50% TAM segment: Healthy range 0.96-1.04 (narrow range)
Why different ranges? Smaller segments naturally have more random variation. The calculator accounts for this statistically.
Column K: Z-Score
- Measures how many standard deviations your actual % is from expected TAM %
- Formula: z = (Actual% – TAM%) / √(TAM% × (1-TAM%) / Sample Size)
- Interpretation:
- |z| < 1.96: Within normal variation
- |z| ≥ 1.96: Statistically significant deviation (p < 0.05)
- |z| ≥ 2.576: Highly significant deviation (p < 0.01)
Column L: P-Value
- Probability that this result could occur by random chance
- Formula: p = 2 × (1 – NORM.S.DIST(|z|, TRUE))
- Interpretation:
- p ≥ 0.05: Not statistically significant (may be random variation)
- p < 0.05: Statistically significant (likely real bias)
- p < 0.01: Highly significant (definitely real bias)
Column M: Stat Sig? (Statistical Significance)
- “Yes” if P-Value < 0.05 (statistically significant)
- “No” if P-Value ≥ 0.05 (not statistically significant)
⚠️ IMPORTANT: “No” means NO BIAS DETECTED—this is GOOD, not bad!
- “Not significant” = the deviation is within normal random variation
- Only act on segments where this says “Yes”
Column N: Status
- Auto-assigns based on BOTH MRI thresholds AND statistical significance
- Logic:
- If MRI outside columns G or J AND Stat Sig = Yes → 🚨 Critical
- If MRI outside columns H-I but within G-J AND Stat Sig = Yes → ⚠️ Warning
- All other cases → ✅ Healthy
CRITICAL: Status requires BOTH conditions:
- MRI outside healthy range (columns H-I), AND
- Statistically significant (p < 0.05)
If MRI is outside range but p ≥ 0.05, status shows “✅ Healthy” because the deviation is not confirmed as real bias.
⚡ COUNTER-INTUITIVE BUT CORRECT: The Sample Size Paradox
You might see something surprising:
Scenario A:
- ✅ Actual sample (1,000) > Min sample needed (457)
- ❌ Status: “Not statistically significant”
- 🤔 Your reaction: “Wait, I have enough samples but it says ‘No’??”
Scenario B:
- ❌ Actual sample (1,000) < Min sample needed (1,537)
- ✅ Status: “Statistically significant”
- 🤔 Your reaction: “Wait, I don’t have enough samples but it says ‘Yes’??”
Why this happens: These are answering DIFFERENT questions.
| What It Asks | Translation |
|---|---|
| Min Sample Needed | “How many samples to reliably detect MRI 0.85 IF it exists?” |
| Stat Sig (Yes/No) | “Is my ACTUAL deviation significant given my current sample?” |
Think of it like binoculars:
- Min Sample = Binoculars power needed to spot a specific size object
- Stat Sig = Whether you can see what’s actually there with your current binoculars
Real-world examples:
| What’s There | Can You See It? | Explanation |
|---|---|---|
| 🦣 Huge deviation (MRI 0.50) | ✅ YES, even with small sample | Like an elephant – obvious even with weak binoculars |
| 🐰 Small deviation (MRI 1.20) | ❌ NO, need large sample | Like a rabbit – need strong binoculars to confirm |
| 🌫️ Zero deviation (MRI 1.00) | ❌ NO, regardless of sample | Nothing there – even best binoculars won’t find it |
The Golden Rule:
✅ Only act on segments where “Stat Sig?” = Yes (p < 0.05)
✅ This means the deviation is CONFIRMED as real bias, not random chance
You may notice counterintuitive patterns:
- Actual sample > Min sample needed → “Not statistically significant”
- Actual sample < Min sample needed → “Statistically significant”
This seems backwards but is statistically correct. Here’s why:
“Min Sample Size Needed” (Column D) answers: “How many samples to reliably detect MRI 0.85 IF it exists?”
“Stat Sig?” (Column M) answers: “Is my ACTUAL deviation statistically significant?”
These are different questions!
Real Examples
Example 1: Zero Deviation
- TAM: 5% → Actual: 5.0% (MRI = 1.00)
- Min Sample Needed: 457
- Actual Sample: 1,000 ✓ (have enough!)
- Stat Sig?: No
- Why? There’s ZERO deviation. Even with 1 million samples, this would be “not significant” because there’s nothing to detect. This is perfect alignment!
Example 2: Small Deviation (Smaller than MRI 0.85 target)
- TAM: 5% → Actual: 6.0% (MRI = 1.20)
- Min Sample Needed: 457 (to detect MRI 0.85)
- Actual Sample: 1,000 ✓ (have enough for MRI 0.85!)
- Stat Sig?: No (P-Value = 0.15)
- Why? The 1% deviation is SMALLER than the 2.5% deviation (MRI 0.85) the calculator was designed to detect. You’d need ~5,000+ samples to reliably catch such a small deviation. Having 1,000 samples is enough to catch MRI 0.85 but NOT enough to catch MRI 1.20.
Example 3: Large Deviation (Larger than MRI 0.85 target)
- TAM: 20% → Actual: 30.0% (MRI = 1.50)
- Min Sample Needed: 1,537 (to detect MRI 0.85)
- Actual Sample: 1,000 ✗ (need more for MRI 0.85)
- Stat Sig?: Yes (P-Value ≈ 0)
- Why? The 10% deviation is so HUGE (MRI 1.50 >> MRI 0.85) it’s obvious even with fewer samples. Z-score = 7.91 (way beyond 1.96 threshold). It’s like using binoculars to spot an elephant—you don’t need full zoom.
The Pattern:
| Deviation Size | Sample Needed | Can Detect With Less? |
|---|---|---|
| Zero (MRI 1.00) | ∞ | ❌ No – nothing to detect |
| Tiny (MRI 1.05) | ~20,000 | ❌ No – too subtle |
| Small (MRI 1.20) | ~5,000 | ❌ Barely |
| Moderate (MRI 0.85) | ~1,500 | ⚠️ As designed |
| Large (MRI 1.50) | ~400 | ✅ Yes – obvious! |
| Huge (MRI 0.68) | ~100 | ✅ Yes – unmistakable! |
Key Takeaway:
- Having MORE samples than needed doesn’t create significance when deviation is small or zero
- Having FEWER samples than needed can still detect significance when deviation is huge
- Only act on deviations with “Stat Sig? = Yes” (p < 0.05)
Step 3: Review Summary Metrics
Scroll down (below your data rows) to see auto-calculated summary:
- Segments in Critical Status: Count of 🚨 Critical segments
- Segments in Warning Status: Count of ⚠️ Warning segments
- Segments Healthy: Count of ✅ Healthy segments
- Statistically Significant Issues: Count where p < 0.05
Key Insight: Only act on segments where BOTH:
- MRI is outside healthy thresholds (Columns H-I), AND
- P-Value < 0.05 (Column L) and shows “Yes” in Column M
This combination identifies true bias vs. normal market variation.
Common Patterns and What They Mean:
Pattern 1: MRI outside range + Stat Sig Yes → 🚨 Real bias detected—take action immediately → Example: MRI 0.68, p < 0.001
Pattern 2: MRI outside range + Stat Sig No → ✅ Likely normal variation—monitor but don’t act yet → Example: MRI 1.20, p = 0.15 → Consider increasing sample size if this pattern persists
Pattern 3: MRI = 1.00 + Stat Sig No → ✅ Perfect alignment—no bias → Example: MRI 1.00, p = 1.0
Pattern 4: Sample size < Min needed + Stat Sig No → ⚠️ Might be missing moderate bias (MRI 0.85-1.15) → Action: Collect more data until you reach “Min Sample Size Needed”
Step 4: Document Findings
Column O: Notes
- Add context about why bias might exist
- Note which tools/campaigns might be responsible
- Flag for follow-up investigation
- Document any changes made to Calculator settings
Column P: Date Checked
- Auto-populates with today’s date
- Update quarterly to track progress
- Update whenever you change Calculator settings and re-run audit
What to Do With Results
🚨If you found Critical bias patterns (MRI <0.70 or >1.30) WITH P-Value <0.05
Statistically confirmed bias—immediate action required
- Proceed immediately to Tab 4 (Bias Pattern Log) to document
- Identify which tools are causing the exclusion (see article Section 1-4)
- Calculate revenue impact in Tab 3
- Implement fixes within 48 hours
⚠️If you found Warning patterns (MRI 0.70-0.84 or 1.16-1.30)
Check P-Value: If <0.05, treat as high priority
- If P-Value ≥0.05, monitor but may be normal variation
- Schedule deeper audit within 30 days if statistically significant
- Document in Tab 4 for tracking
ℹ️If MRI is low BUT P-Value >0.05
May be random variation, not systematic bias
- Increase sample size and re-test
- Monitor quarterly to see if pattern persists
✅If all segments are Healthy
- Great! Schedule quarterly re-audit
- Still complete Tab 2 for ongoing monitoring
- Consider auditing additional channels
What Good Looks Like: Interpreting Your Results
After running your first audit, you’ll have MRI scores and p-values for each segment. Here’s how to interpret them.
Healthy Marketing Automation
Your marketing is well-calibrated if you see:
✅ Quantitative Indicators:
- MRI scores between 0.85-1.15 for all segments
- P-values > 0.05 (no statistical significance)
- TAM coverage within ±15% for segments >10% of market
- No segment below 80% of expected representation
✅ Qualitative Signs:
- Creative and messaging appeal to diverse segments
- Conversion rates similar across demographics
- Customer satisfaction scores consistent
- Sales team reports balanced pipeline
Example of Healthy Results:
| Segment | TAM % | Actual % | MRI | P-Value | Interpretation |
|---|---|---|---|---|---|
| 18-24 | 5% | 4.8% | 0.96 | 0.73 | Perfect—within normal variation |
| 25-34 | 20% | 21% | 1.05 | 0.45 | Excellent alignment |
| 35-50 | 50% | 49% | 0.98 | 0.67 | Ideal performance |
| 51-65 | 20% | 21% | 1.05 | 0.51 | Well calibrated |
| 65+ | 5% | 4.2% | 0.84 | 0.31 | Close enough (small segment) |
What this means: Your algorithms are serving all segments proportionally. Continue quarterly monitoring to maintain this state.
Warning Signs (Investigate Within 30 Days)
Your marketing needs attention if you see:
⚠️ Quantitative Indicators:
- MRI between 0.70-0.84 or 1.16-1.30 for any segment
- P-values < 0.05 for secondary segments
- Large segments (>20% TAM) outside healthy range
- Consistent drift in same direction over 2+ quarters
⚠️ Qualitative Signs:
- Customer complaints about targeting
- Sales team mentions “we’re missing a segment”
- Competitive losses in specific demographics
- Unequal performance across regions
Example of Warning-Level Results:
| Segment | TAM % | Actual % | MRI | P-Value | Action Needed |
|---|---|---|---|---|---|
| 18-24 | 5% | 5.1% | 1.02 | 0.87 | ✅ Monitor only |
| 25-34 | 20% | 26% | 1.30 | 0.02 | ⚠️ Slightly over—investigate |
| 35-50 | 50% | 43% | 0.86 | 0.01 | ⚠️ Slightly under—investigate |
| 51-65 | 20% | 20.5% | 1.03 | 0.78 | ✅ Healthy |
| 65+ | 5% | 5.4% | 1.08 | 0.61 | ✅ Healthy |
What to do:
- Document pattern in Tab 5 (Bias Pattern Log)
- Check if trend is worsening (compare to last quarter)
- Identify likely root cause (review Four Bias Amplifiers in article)
- Implement fix within 30 days
- Re-audit in 60 days to verify improvement
Critical Issues (Immediate Action Required)
Your marketing has serious bias if you see:
🚨 Quantitative Indicators:
- MRI < 0.70 or > 1.30 for any segment
- P-values < 0.01 for any segment (highly significant)
- Multiple segments with p < 0.05
- Largest TAM segment is smallest conversion segment
🚨 Qualitative Signs:
- Regulatory inquiries about targeting
- Viral social media complaints
- Dramatic performance decline
- Executive concern about market coverage
Example of Critical Results:
| Segment | TAM % | Actual % | MRI | P-Value | Severity |
|---|---|---|---|---|---|
| 18-24 | 5% | 5% | 1.00 | 0.99 | ✅ Healthy |
| 25-34 | 20% | 31% | 1.55 | <0.001 | 🚨 Critical over |
| 35-50 | 50% | 32% | 0.64 | <0.001 | 🚨 Critical under |
| 51-65 | 20% | 26% | 1.30 | 0.02 | ⚠️ Warning |
| 65+ | 5% | 6% | 1.20 | 0.31 | ✅ Healthy |
What this means: You’re losing significant revenue. Ages 35-50 are 50% of your market but only 32% of conversions. This is costing you ~$200K-$500K annually (typical).
Immediate actions:
- STOP optimizations on affected campaigns (prevent further drift)
- Calculate revenue at risk using Tab 4
- Present findings to leadership TODAY
- Implement emergency fix within 48 hours:
- Add manual audience signals
- Rebalance training data
- Create dedicated campaign for excluded segment
- Set daily monitoring until MRI > 0.85
Industry Benchmarks
Compare your results to these generalized expectations for typical companies:
First Audit Expectations
- 50/50 you’ll have at least one MRI < 0.70 (critical bias)
- 1-3 critical patterns identified
- Largest TAM segment is under-served
- $200K-$500K in revenue at risk annually
What to Watch for by Industry
- B2B SaaS: Usually under-serves 35-50 age group (core decision-makers)
- E-commerce: Often over-indexes on 18-34, misses 35-65 (higher LTV)
- B2B Services: Frequently excludes smaller companies (filters by size)
- Financial Services: Common to under-represent older demographics (higher assets)
Time Required to Fix Issues
- Emergency fixes: 2-4 hours implementation
- See improvement: 30-60 days
- Full resolution: 90 days
- Prevention: Quarterly 30-min audits
ROI Targets
- Conservative: 3-5x return (year one)
- Average: 5-10x return
- Best case: 10x+ return
- Cost of inaction: Compounds 5-10% quarterly
Progression Over Time
Quarter 1: Discovery
- First audit reveals 2-3 bias patterns
- MRI scores: 0.65-0.75 (critical)
- Revenue at risk: $200K-$500K
- Status: 🚨 Emergency
Quarter 2: Implementation
- Fixes applied, monitoring established
- MRI scores: 0.75-0.85 (improving)
- Revenue captured: 20-40% of gap
- Status: ⚠️ Improving
Quarter 3: Stabilization
- Algorithms rebalanced, new patterns learned
- MRI scores: 0.85-0.95 (healthy range)
- Revenue captured: 60-80% of gap
- Status: ✅ Monitoring
Quarter 4: Maintenance
- Ongoing quarterly audits
- MRI scores: 0.90-1.10 (optimal)
- Revenue captured: 80-95% of gap
- Status: ✅ Healthy
Year 2+: Prevention
- Bias catches prevented before compounding
- Consistent MRI scores across segments
- Competitive advantage maintained
- Status: ✅ Best practice
Your Audit Scorecard
Use this to assess your current state:
Excellent (90-100 points)
- All MRI scores 0.90-1.10 ✅ (50 pts)
- All p-values > 0.05 ✅ (30 pts)
- Quarterly audit cadence ✅ (10 pts)
- Executive oversight ✅ (10 pts)
Industry leader—maintain and share practices
Good (70-89 points)
- Most MRI scores 0.85-1.15 ⚠️ (40 pts)
- Few p-values < 0.05 ⚠️ (20 pts)
- Semi-annual audits ⚠️ (5 pts)
- Team-level monitoring ✅ (10 pts)
Good position—minor improvements needed
Fair (50-69 points)
- Some MRI scores < 0.85 or > 1.15 ⚠️ (30 pts)
- Multiple p-values < 0.05 ⚠️ (10 pts)
- Annual or no audits ❌ (0 pts)
- No formal oversight ❌ (0 pts)
Significant gaps—implement fixes this quarter
Poor (<50 points)
- Multiple MRI scores < 0.70 or > 1.30 🚨 (10 pts)
- Many p-values < 0.01 🚨 (0 pts)
- Never audited ❌ (0 pts)
- No awareness of issue ❌ (0 pts)
Critical state—emergency response required
Tab 3: Full Framework Tracker
⏱️ Time estimate: Varies by step (2 hours to 5 hours per step)
This tab helps you implement the complete 5-step Bias-Debt Framework across your marketing stack. Here’s how to use it:
1. MAP – Document all data sources (⏱️ 2 hours initial investment)
- Document all data sources feeding your AI (CRM, ad platforms, analytics)
- Create data lineage diagram: CRM → Audience Builder → Ad Platform → Results
- Note data age, scope, and collection method
- Red flag: Any data older than 3 years without refresh
2. MEASURE – Run quarterly MRI audits (⏱️ 30 min per channel)
- Run MRI (Market Representation Index) + z-test audit from Tab 1
- Compare distributions to TAM using statistical tests
- Document gaps with p-values < 0.05 (statistically significant)
- Red flag: Any segment with MRI <0.70 or >1.30 AND p-value <0.05 (statistically confirmed bias)
3. MONITOR – Define KPIs and alerts (⏱️ 1 hour initial, 15 min monthly)
- Document what KPIs your algorithms optimize for
- Check if KPIs reward diversity or narrow focus
- Set up automated alerts when segments drop below 80% of TAM
- Red flag: KPIs that reward short-term efficiency without representation constraints
4. MITIGATE – Fix bias patterns as discovered (⏱️ 3-5 hours per fix)
- Inject balancing data or diversity constraints
- Add manual overrides for underserved segments
- Retrain models with balanced data
- Red flag: Team resistance (“but the algorithm knows best”)
5. MAINTAIN – Schedule recurring audits (⏱️ 4 hours quarterly)
- Schedule recurring bias audits (add to calendar)
- Assign clear ownership (name responsible person)
- Require executive review of results
- Red flag: Going >6 months without an audit
For each task:
✅ Update Status dropdown (Not Started → In Progress → Completed)
Select from dropdown
- Not Started
- In Progress
- Completed
- Blocked (explain in Notes)
- Skipped (explain why)
🗓️ Log Start and End Dates
Track when you begin and end each step. Consider mapping steps to sprints with clear deadlines to maintain progress.
⏱️ Log actual hours spent
Log actual time investment
- Use for future planning
- Share with leadership to justify resources
👤 Assign clear ownership
Assign task to a responsible person.
📝 Add notes on blockers or decisions
Add specifics
- Blockers encountered
- Decisions made
- Next actions
Review progress summary at bottom to track completion percentage and total time invested.
💡 Pro tip: Make this a standing agenda item in sprint planning. Treat bias audits like code reviews – routine, not special projects.
Review Progress Summary
Bottom section auto-calculates:
- Total tasks completed
- Completion percentage
- Total hours invested
💡 Tip: Review this tab in weekly team meetings. Make bias audits a standing agenda item alongside performance reviews.
Tab 4: Revenue Impact Calculator
⏱️ Time estimate: 15 minutes per segment with bias issues
Quantify the business case for bias correction by calculating revenue at risk from excluded market segments. Fill in all fields highlighted in ORANGE only. Fields in GREEN are AUTO-CALCULATED.
Here’s the workflow:
Section A – Market Size (REQUIRES INPUT)
- Total Addressable Market: Total number of potential customers annually
- Average Customer Value: Lifetime value or annual contract value
- Total Market Opportunity: Auto-calculates (TAM × Avg Value)
Example:
- TAM: 10,000 potential customers
- Avg Value: $1,200
- Opportunity: $12,000,000
Section B – Current Performance (REQUIRES INPUT)
- Current Annual Conversions: Total conversions last 12 months
- Current Conversion Rate: Auto-calculates
- Current Annual Revenue: Auto-calculates
Section C – Bias Analysis (REQUIRES INPUT)
- Under-Represented Segment % of TAM: From Quick Audit (Tab 1). Enter the expected TAM percentage for the under-represented segment.
- Example: If ages 51+ = 30% of TAM but you’re only reaching 12%, enter 30% here.
- Note: Only include segments where p-value <0.05 (statistically confirmed bias).
- P-Value from Z-Test: Enter from Tab 1 This validates that the bias is statistically significant Only calculate revenue impact for segments with p-value <0.05 Random market variations won’t produce reliable projections .
- Example: If p-value = 0.001, this segment’s under-representation is highly significant.
- Current Coverage of This Segment: Actual performance
- Example: Enter 12%
- Gap: Auto-calculates difference (18% in this example)
- P-Value from Z-Test: ⚠️ MUST be < 0.05 to proceed – only calculate for statistically significant bias
Section D – Revenue Impact (AUTO-CALCULATES)
The calculator estimates:
- Potential Additional Customers: If you closed the gap
- Conservative Capture Rate: Assumes you can capture 25% of the gap
- Potential Additional Revenue: Annual opportunity
- ANNUAL REVENUE AT RISK: Total potential revenue being lost. This number is your business case for investing in bias correction.
Use the Scenario Analysis Table to show leadership:
- Conservative (25%): Modest improvements, lowest risk
- Moderate (50% of gap): Balanced approach, recommended
- Aggressive (75% of gap): Comprehensive fixes, highest upside
Each scenario calculates:
- Coverage improvement
- Estimated additional revenue
- Implementation cost (you can edit this)
- Net benefit
- ROI
How to use: Show this to leadership to justify bias audit investment. Even conservative scenarios typically show 5-10x ROI.
Tab 5: Bias Pattern Log
This tab is your bias issue tracking system. Here you can maintain a running log of all bias patterns discovered, fixes applied, and outcomes tracked.
⏱️ Time estimate: 10 minutes per bias pattern to document thoroughly
For each bias pattern discovered:
Required Fields:
- Date: When bias was identified
- Channel/Tool: Which system showed the bias
- Examples: Google Ads, HubSpot, Email Platform
- Bias Type: Select from dropdown
- Automation Bias (trusting the machine too much)
- Data Representation Bias (garbage in, garbage amplified)
- Confirmation Bias Loop (algorithm learns your blind spots)
- Survivorship Bias (rewarding what’s visible, ignoring what’s lost)
- Other
- Affected Segment: Which demographic or group
- MRI Score: From your Quick Audit (Market Representation Index) (e.g., 0.40 = severe under-representation)
- P-Value: Statistical significance (from Tab 1) (⚠️ must be < 0.05)
- Description: What’s happening (be specific)
- Example: “Older demographics excluded from Performance Max campaigns (MRI: 0.40, p<0.001)”
- Root Cause: Why it’s happening
- Example: “Lookalike audience trained on young-skewing data”
- Fix Applied: What you did to correct it
- Example: “Added age-diverse audience signals to Performance Max”
- Status: Select from dropdown
- Identified
- Investigating
- Fix in Progress
- Fixed
- Monitoring (post-fix)
- Closed
- Follow-Up Date: When to re-check (typically 30 days post-fix)
Review Summary Metrics auto-calculated at bottom:
- Total biases identified
- Currently active issues
- Fixed and monitoring
- Closed cases
💡 Best practice: Review this log in monthly leadership meetings. If you see the same bias type repeatedly, you have a systemic issue requiring process changes, not just individual fixes.
📖 For detailed fix strategies, see article section “The Four Bias Amplifiers”
Frequently Asked Questions
Getting Started
I haven’t read the Hackernoon article. Can I still use this template?
Yes, this template is self-contained. However, understanding the “why” helps significantly:
- Article explains: The four bias amplifiers (Automation, Data, Confirmation, Survivorship) and how bias compounds
- Template provides: The detection and tracking tools
- Together: You get both understanding and execution
If you skip the article, at least read the “Real-World Example Walkthrough” section above—it shows the complete process from start to finish.
What if I don’t have demographic data yet?
Start collecting immediately, then audit in 30-60 days:
Google Ads:
- Go to Campaign Settings → Demographics
- Enable demographic reporting for age and gender
- Historical data will populate within 24-48 hours
Meta Ads:
- Ads Manager → Settings → Demographics
- Already enabled by default
- Check Reports → Demographics tab
CRM/Email (HubSpot, Salesforce, Marketo):
- Use data enrichment: Clearbit ($99/mo), ZoomInfo (enterprise)
- Import demographic data via API
- Enrichment typically adds data to 60-80% of contacts
Timeline:
- Start today → Have 100+ conversions with demographics in 7-14 days
- Wait 30 days → Have 400-500 conversions (enough for initial audit)
- Wait 60-90 days → Have 1,000+ conversions (full statistical power)
Interim action: Run a manual spot-check on small sample to get directional insights.
How do I know if my MRI score is “bad enough” to act on?
Use BOTH MRI threshold AND p-value together. You need both conditions to confirm real bias:
Decision Matrix:
| MRI Score | P-Value | Status | Action |
|---|---|---|---|
| 0.85-1.15 | >0.05 | ✅ Healthy | Monitor quarterly |
| 0.85-1.15 | <0.05 | ⚠️ Attention | Investigate (minor deviation) |
| 0.70-0.84 or 1.16-1.30 | >0.05 | ⚠️ Warning | Increase sample size |
| 0.70-0.84 or 1.16-1.30 | <0.05 | 🚨 Warning | Fix within 30 days |
| <0.70 or >1.30 | >0.05 | ⚠️ Possible | Collect more data |
| <0.70 or >1.30 | <0.05 | 🚨 Critical | Fix within 48 hours |
Remember: P-value < 0.05 means “this is real bias, not random chance.” Only act when this condition is true.
What if I don’t understand z-tests or p-values?
You don’t need to understand the math—the template calculates everything automatically. Just know these three rules:
Rule 1: Look at Column M (Stat Sig?)
- “Yes” = Real bias confirmed (act on it)
- “No” = Might be normal variation (monitor only)
Rule 2: Look at Column N (Status)
- 🚨 Critical = Fix immediately
- ⚠️ Warning = Fix within 30 days
- ✅ Healthy = Monitor quarterly
Rule 3: Only act when BOTH conditions are true:
- MRI outside healthy range (Columns H-I)
- AND Statistical significance = “Yes” (Column M)
That’s it. The template tells you what to do.
Can I use this if I’m not a “data person”?
Absolutely. If you can:
- ✅ Export CSV files from ad platforms (Google Ads, Meta)
- ✅ Enter numbers in Excel/Google Sheets
- ✅ Follow step-by-step instructions
Then you can use this template.
Skill level required:
- Advanced Excel: ❌ No
- Statistics background: ❌ No
- Data science: ❌ No
- Basic spreadsheet skills: ✅ Yes
- Ability to export reports: ✅ Yes
- Reading comprehension: ✅ Yes
Focus on:
- The “Quick Action Summary” boxes—they tell you exactly what to do
- The “Real-World Example”—shows the complete process
- Column M (Stat Sig?) and Column N (Status)—these tell you when to act
Technical Questions
Why do MRI thresholds vary by segment size?
This is statistically correct—smaller segments have wider acceptable variation:
Think of it like throwing darts:
- Small segment (5% TAM) = Small target, harder to hit precisely
- Acceptable range: 0.60-1.40 (±40%)
- Example: Hitting 3% when expecting 5% is normal variation
- Large segment (50% TAM) = Big target, should hit consistently
- Acceptable range: 0.96-1.04 (±4%)
- Example: Hitting 48% when expecting 50% is fine, but 40% is a problem
Why it matters:
- 5% segment dropping to 3% = MRI 0.60 = ✅ Healthy (within expected variation)
- 50% segment dropping to 40% = MRI 0.80 = 🚨 Critical (systematic exclusion)
The template automatically adjusts expectations based on statistical reality.
What’s the minimum sample size I need?
It depends on what you want to detect. Generally, for different precision levels:
| Goal | Min Sample | What You Can Detect |
|---|---|---|
| Detect severe bias (MRI 0.70) | ~400 | Major exclusions only |
| Detect moderate bias (MRI 0.85) | ~1,000 | Most meaningful patterns |
| Detect mild bias (MRI 0.95) | ~2,400 | Even small deviations |
| Detect tiny bias (MRI 1.05) | ~10,000 | Nearly perfect alignment |
Practical guidance:
- 400-600 conversions: Run a pilot audit, catch severe issues
- 1,000 conversions: Standard audit, catch most problems (recommended)
- 2,400+ conversions: High-precision audit, catch everything
Important: The template calculates exact minimum sample sizes for your specific TAM breakdown (Column D in Tab 2). These are customized to your business.
Why does my largest segment need the most samples?
Larger segments have tighter thresholds, requiring more samples to verify:
Example with 1,000 total conversions:
| Segment | TAM % | Min Samples | Why |
|---|---|---|---|
| 5% segment | 5% | 457 | Wide acceptable range (0.60-1.40) |
| 20% segment | 20% | 1,537 | Moderate range (0.90-1.10) |
| 50% segment | 50% | 2,401 | Narrow range (0.96-1.04) |
The 50% segment needs the most samples because even small deviations matter at that scale.
What if my actual sample size is less than the minimum needed?
You can still run the audit, but with limitations:
Scenario: You have 800 conversions, but template says you need 2,401 for your 50% segment.
What happens:
- ✅ You can still detect SEVERE bias (MRI < 0.70)
- ⚠️ You might miss MODERATE bias (MRI 0.85)
- ❌ You can’t detect MILD bias (MRI 0.95)
Solution options:
- Run audit anyway with 800 samples
- Will catch big problems
- Might miss smaller issues
- Better than not auditing at all
- Lower precision target in Calculator (Tab 1, Cell B11)
- Change from ±2% to ±3%
- Reduces required samples by ~55%
- Still catches meaningful bias
- Wait and collect more data
- Continue running campaigns
- Audit when you hit 1,000+ conversions
- More thorough first audit
Best practice: Start with what you have. Even 400-600 conversions reveals critical issues.
Process Questions
How often should I run audits?
Quarterly is ideal, with risk-based adjustments.
Standard Schedule:
- Q1, Q2, Q3, Q4: Full audit (30 min each)
- Monthly: Quick spot-check on key segments (10 min)
- Weekly: Monitor dashboard alerts
Adjust frequency based on risk:
Audit MORE often if:
- High ad spend (>$100K/month) → Monthly
- Frequent algorithm changes → After each major change
- Found critical bias previously → Bi-monthly until resolved
- Highly regulated industry → Monthly with executive review
Audit LESS often if:
- Low ad spend (<$20K/month) → Semi-annually
- Stable algorithms (no major changes) → Semi-annually
- Clean history (no bias found) → Semi-annually with spot-checks
Never audit less than semi-annually. Bias can develop within 3-6 months as algorithms retrain.
What counts as a “major campaign change” that triggers re-audit?
Re-audit within 30 days after any of these:
Algorithm changes:
- ✅ Switched to Performance Max or Auto campaigns
- ✅ Changed optimization goal (clicks → conversions)
- ✅ Enabled new automated bidding strategy
- ✅ Major budget increase (>30%)
Targeting changes:
- ✅ Expanded to new geographic regions
- ✅ Added new audience segments
- ✅ Changed demographic targeting parameters
Creative changes:
- ✅ New messaging strategy or brand positioning
- ✅ Different creative approach (imagery, tone)
- ⚠️ Minor copy tweaks → Wait for next quarterly audit
Platform changes:
- ✅ Launched on new channel (LinkedIn, TikTok, etc.)
- ✅ Major platform update (Google/Meta algorithm changes)
Why this matters: Algorithm retraining on new parameters can introduce bias within 2-4 weeks.
Should I audit each channel separately or combined?
BOTH—start combined, then drill down.
Step 1: Combined Audit (Recommended first audit)
- Aggregate all conversions across channels
- Reveals overall bias in marketing system
- Fastest way to get baseline (30 min)
Step 2: Channel-Specific Audits (After first combined)
- Run separate audit for each major channel:
- Google Ads (separate audit)
- Meta Ads (separate audit)
- LinkedIn (separate audit)
- Organic (if you have demographic data)
- Identifies which channel has the bias
- Takes 30 min per channel
Example findings:
- Combined audit: Ages 35-50 under-represented (MRI 0.68)
- Google Ads: Ages 35-50 critically low (MRI 0.55)
- Meta Ads: Ages 35-50 healthy (MRI 0.95)
- LinkedIn: Ages 35-50 slightly over (MRI 1.10)
Conclusion: Google Ads is the problem channel. Focus fixes there first.
Best practice:
- Year 1, Audit 1: Combined (establishes baseline)
- Year 1, Audits 2-4: Combined + top 2 channels
- Year 2+: Combined + all major channels quarterly
Problem-Solving
I found bias—now what?
Follow this 48-hour action plan:
Hour 1-2: Document and Quantify
- Log finding in Tab 5 (Bias Pattern Log)
- Calculate revenue impact in Tab 4
- Identify bias type from article (Automation, Data, Confirmation, Survivorship)
- Take screenshots of current MRI scores
Hour 3-24: Present and Get Approval
- Create 1-slide executive summary:
- Problem: “Ages 35-50 under-represented (MRI 0.68, p<0.001)”
- Impact: “$230K annual revenue at risk”
- Solution: “Add audience signals, rebalance data ($0 new spend)”
- Timeline: “Implement in 2 hours, see results in 30 days”
- Present to leadership for awareness (not approval—you’re fixing this)
Hour 24-48: Implement Fix
- Apply relevant fix from article “Four Bias Amplifiers” section:
- Automation Bias → Add human review checkpoints
- Data Bias → Rebalance training data
- Confirmation Bias → Inject counter-examples
- Survivorship Bias → Multi-touch attribution
- Set up monitoring dashboard
- Schedule 30-day re-audit
Next 30 Days: Monitor and Adjust
- Weekly spot-checks on affected segment
- Adjust if MRI not improving
- Document learnings
Day 30: Re-Audit
- Run full audit
- Verify MRI improved to >0.85
- Calculate revenue captured
- Report results to leadership
Leadership won’t prioritize this—how do I get buy-in?
Use the three-number pitch:
Your 30-second pitch:
“Our algorithms are systematically excluding [X demographic], which represents [Y%] of our target market. This is costing us approximately [$Z] annually—[calculate from Tab 4]. Fixing this requires [2 hours implementation], no new budget, and we’ll see results in 30 days. Our competitors likely have the same blind spot, so this is a competitive advantage. Can I spend 2 hours this week implementing the fix?”
Example:
“Our algorithms are excluding ages 35-50 (managers and directors), which represents 50% of our target market. This is costing us approximately $230K annually. Fixing this requires 2 hours of implementation time, no new ad budget, and we’ll see results within 30 days. The ROI could be as much as 15x in year one. Since our competitors are likely making the same mistake, fixing this is a competitive advantage. Can I implement this week?”
If they say “prove it first”:
- Show Tab 2 (Quick Audit) with MRI scores and p-values
- Show Tab 4 (Revenue Calculator) with dollar amounts
- Reference industry benchmarks from article (10-15% revenue impact)
- Offer to pilot on one campaign first
If they say “we can’t afford the time”:
- Point out you’ve already done the audit (30 min)
- Implementation is 2 hours, not 20 hours
- NOT implementing costs $X per month in lost revenue
- Frame as “preventing revenue loss” not “creating extra work”
If they say “but the algorithm knows best”:
- Share Derek Mobley story from article (AI hiring discrimination)
- Explain algorithms amplify historical patterns, including biases
- Note EEOC and FTC are paying attention to algorithmic discrimination
- Position as risk mitigation, not just revenue opportunity
I fixed the bias but it came back—why?
Bias recurrence has three common causes:
Cause 1: Algorithm Retrained on New Data (Most Common)
- You fixed it in Month 1
- Algorithm retrained in Month 2-3 using new conversions
- New conversions still skewed (from time lag)
- Bias pattern re-emerged
Solution:
- Set monitoring alerts (Tab 3, Step 3)
- Re-apply fix quarterly until pattern breaks
- Add diversity constraints to prevent drift
Cause 2: Incomplete Fix
- You fixed the symptom, not root cause
- Example: Added audience signals but didn’t rebalance training data
- Bias persisted in another part of the system
Solution:
- Review all Four Bias Amplifiers from article
- Apply fixes to ALL relevant areas
- Check if bias moved to different segment
Cause 3: New Source of Bias Introduced
- Launched new campaign that reintroduced bias
- Changed optimization goal
- Platform algorithm update
Solution:
- Audit after any major change
- Compare current audit to previous
- Identify what changed between audits
What if different channels show opposite biases?
This reveals interesting insights:
Example Pattern:
- Google Ads: Ages 18-34 over-represented (MRI 1.40)
- LinkedIn: Ages 35-65 over-represented (MRI 1.30)
- Meta: Balanced across all ages (MRI 0.95-1.05)
What this means:
- Each platform algorithm has different bias
- Overall (combined) might look balanced but is actually unbalanced per-channel
- You’re over-spending on “wrong channels” for each segment
Action:
- Shift budget by segment:
- Ages 18-34: Reduce Google, increase LinkedIn
- Ages 35-65: Reduce LinkedIn, increase Google
- Continue balanced approach on Meta
- Platform algorithms are self-selecting by demographic
- Match creative to platform bias (until you rebalance)
Key insight: Combined audits mask channel-level issues. Always drill down.
Can I customize segments beyond the default age ranges?
Absolutely—use any demographic that matters to your business. Just keep in mind that different ad platforms may limit targeting capabilities (e.g. by ethnicity), either due to unavailable data, or anti-discrimination policies.
Common alternatives to age:
By Gender:
- Male, Female, Non-binary, Prefer not to say
By Geography:
- West Coast, Midwest, South, Northeast, International
- Or: US, Canada, UK, EU, APAC
By Company Size:
- 1-10 employees, 11-50, 51-200, 201-1000, 1000+
By Industry:
- Technology, Healthcare, Financial Services, Retail, Manufacturing
By Job Title:
- Individual Contributor, Manager, Director, VP, C-Suite
By Income/Budget:
- <$50K, $50K-$100K, $100K-$200K, $200K+
How to customize:
- Go to Tab 1, Rows 20-24, Column A
- Replace age ranges with your segments
- Research TAM % for each (Column B)
- Enter actual conversion % (Column C)
- Everything else auto-calculates
Best practice: Start with 5 segments, expand to 7-10 once comfortable.
Advanced Topics
Should I weight segments differently based on LTV?
The template doesn’t do this automatically, but you can:
Standard approach (used by template):
- All segments treated equally by representation
- Goal: Match conversions to TAM %
- Example: 20% TAM segment should be ~20% of conversions
LTV-weighted approach (manual adjustment):
- Adjust TAM based on value per segment
- Higher LTV segments get higher TAM %
- Requires manual calculation
Example:
| Segment | Pop % | Avg LTV | Weighted TAM % |
|---|---|---|---|
| 18-24 | 10% | $500 | 5% |
| 25-34 | 30% | $1,000 | 25% |
| 35-50 | 40% | $2,000 | 55% |
| 51-65 | 20% | $1,500 | 15% |
Weighted TAM calculation:
(Segment % × LTV) ÷ (Total of all Segment % × LTV)
When to use LTV-weighting:
- Dramatic LTV differences (>2x between segments)
- Limited marketing budget (focus on highest value)
- Mature business optimizing for profit over growth
When NOT to use:
- Similar LTVs across segments (<1.5x difference)
- Growth-stage business (want broad coverage)
- First audit (keep it simple)
Recommendation: Start with standard approach, add LTV-weighting after 2-3 audits if needed.
How do I handle “Unknown” or “Prefer not to say” demographics?
Three approaches depending on percentage:
If <5% unknown: Exclude from audit
- Remove from both TAM and Actual percentages
- Note: “Analysis based on X% of conversions with known demographics”
- Acceptable data quality
If 5-15% unknown: Distribute proportionally
- Assume unknowns match TAM distribution
- Example: If TAM is 20% ages 25-34, assume 20% of unknowns are ages 25-34
- Note this assumption in documentation
If >15% unknown: Fix data quality first
- Too much missing data for valid audit
- Implement demographic enrichment (Clearbit, ZoomInfo)
- Collect 30-60 days of clean data
- Then run audit
Common causes of “unknown”:
- Privacy settings (increasing with iOS14+, GDPR)
- Platform limitations (some channels don’t collect demographics)
- Data not enriched (CRM lacks demographic append)
Practical tip: Most ad platforms (Google, Meta, LinkedIn) provide demographics for 85-95% of conversions. If yours is lower, check platform settings.
What if I serve multiple products with different TAMs?
Run separate audits per product line:
Scenario: You sell both consumer software ($50) and enterprise software ($50K).
Approach 1: Separate Audits (Recommended)
- Consumer TAM: Ages 18-34 (70%), 35-50 (25%), 51+ (5%)
- Enterprise TAM: Ages 25-34 (15%), 35-50 (60%), 51-65 (25%)
- Run completely separate audits
- Different MRI thresholds per product
Approach 2: Combined with Filters
- Tag conversions by product in your data
- Filter each product separately before exporting
- Run audit on each subset
Approach 3: Weighted Blended (Not Recommended)
- Calculate blended TAM based on revenue mix
- Loses detail on per-product bias
- Only use if products are 80% overlapping in TAM
Best practice: If your products have different ideal customers, audit them separately.
Tab 6: Example Data
See a real-world scenario showing how bias manifests and how to interpret results.
The Scenario
B2B SaaS company selling project management software discovers their algorithms strongly favor mid-size companies at the expense of small businesses.
What to Learn
Review the data
- Notice how MRI scores reveal the problem
- See how z-test confirms statistical significance
- Understand how p-values distinguish true bias from random variation
- Review the revenue impact calculation for confirmed bias patterns
Read the analysis
- Likely root causes identified
- Recommended fixes listed
- Implementation priority suggested
Use this as a template
- Your bias patterns will look similar
- Apply the same diagnostic approach
- Adapt the fixes to your context
Best Practices
Frequency
- Quick Audit (Tab 1): Monthly for high-spend channels, quarterly for others
- Full Framework (Tab 2): Quarterly deep dive
- Revenue Calculator (Tab 3): When bias is discovered, annually for planning
- Bias Log (Tab 4): Log immediately when bias is found, review monthly
Team Roles
Who should use this template:
- Marketing Ops Lead (primary owner)
- Demand Gen Manager (contributor)
- Analytics/Data Team (data provider)
- CMO/Leadership (reviewer)
Assign clear ownership:
- One person responsible for keeping template updated
- Calendar recurring audits (treat like financial close)
- Include in performance reviews
Integration with Existing Tools
Export data from:
- Google Ads → Reports → Download
- Meta Ads → Ads Manager → Export
- HubSpot → Contacts → Export
- Salesforce → Reports → Export
Import into Tab 1:
- Summarize demographic breakdowns
- Calculate percentages
- Enter into template
When to Update
✅ Update immediately when:
- You discover a new bias pattern
- You implement a fix
- You complete a framework step
- Monthly at minimum
✅ Full re-audit when:
- Quarterly (scheduled)
- After major campaign changes
- When switching tools/platforms
- If performance drops unexpectedly
Troubleshooting
“My totals don’t add to 100%”
Solution: Check your TAM percentages and Actual Conversions percentages. Each should sum to 100%. If actual conversions don’t sum to 100%, you may have uncategorized data—check your source data.
“I don’t have demographic data”
Solution:
- Enable demographic tracking in your ad platforms (Google Ads, Meta Ads both have this)
- For email/CRM: Use append services (Clearbit, ZoomInfo) to enrich contact data
- For website: Enable Google Analytics 4 demographics
- Start collecting now; audit in 30 days when you have sufficient data
“My MRI scores are all Critical”
First, understand that MRI (Market Representation Index) measures how well your actual conversions match your target market. Critical scores (<0.70 or >1.30) indicate severe misalignment.
Possible causes:
- Check p-values first: If p-values >0.05, increase sample size before concluding bias
- Your TAM definition may be wrong—verify with market research
- Your targeting is severely biased—if p-values <0.05, immediate action needed
- Sample size too small—ensure you’re using 1,000+ conversions for reliable z-test
- Data quality issue—verify source data accuracy
“My p-values show ‘No’ for statistical significance”
Possible causes:
- Sample size may be too small—collect more data (aim for 1,000+ conversions)
- MRI deviation may be within normal random variation—monitor quarterly
- Your marketing may actually be well-calibrated—great news!
- If MRI is extreme (<0.70) but p>0.05, increase sample and re-test
“I found bias, now what?”
Immediate actions:
- Go to the article, Section “The Four Bias Amplifiers”
- Identify which type of bias you’re seeing (Automation, Data, Confirmation, Survivorship)
- Follow the tactical implementation instructions for your specific tools
- Document in Tab 4
- Re-audit in 30 days to measure improvement
“Leadership won’t prioritize this”
Solution: Use Tab 3 (Revenue Impact Calculator) to show:
- Exact dollar amount at risk
- ROI of fixing the bias (typically 5-10x)
- Comparison to cost of doing nothing
- Present as a growth opportunity, not an ethics issue
Success Metrics
You’re doing it right if…
- You run audits quarterly (or more frequently)
- Your MRI scores improve over time
- You catch and fix bias before it significantly impacts revenue
- Team discusses bias in regular meetings (not just one-off projects)
- Leadership reviews bias metrics alongside other KPIs
Red flags that you’re not doing it right…
- Haven’t opened the template in >6 months
- Same bias patterns keep appearing
- No one knows who owns bias audits
- Bias correction is seen as “nice to have” not “must do”
- You’re surprised when a segment complains about exclusion
Advanced Tips
For Google Sheets Users
- File → Make a copy to create your own editable version
- Share with team and set appropriate permissions
- Use Apps Script to automate data imports from ad platforms
- Set up email reminders for quarterly audits
- Create dashboard view using Google Data Studio
For Excel Users
- Enable AutoSave if using OneDrive/SharePoint
- Protect formulas (Review → Protect Sheet) to prevent accidental changes
- Use Power Query to automate data refreshes from APIs
- Create PivotTables in separate sheets for executive dashboards
- Enable Track Changes for team collaboration
Customization
Feel free to:
- Add rows for your specific demographic segments (gender, location, industry, etc.)
- Add additional tabs for channel-specific audits
- Modify the example data to reflect your business
- Adjust MRI thresholds if your industry has unique needs (but keep z-test at p<0.05)
- Adjust default sample size if you consistently analyze larger datasets
- Add your company branding
Do NOT modify:
- Z-test formulas (they’re statistically validated)
- P-value threshold of 0.05 (standard statistical significance level)
Do NOT:
- Delete formula cells (you’ll break calculations)
- Change column orders without updating formulas
- Share with unprotected formulas in production use
Please:
- Keep the Instructions tab intact with a link to this page, and a note describing the modifications you made.
Getting Help
Questions?
- About the framework: Read the full article at HackerNoon
- About the template: Contact me
- About your specific bias patterns: Join the discussion in the article comments
Additional Resources
- Full article: How AI-Driven Marketing Amplifies Your Team’s Bias — and How to Fix It (COMING SOON)
- Part 1: Cognitive Bias Is the New Technical Debt in Marketing
Legal Disclaimer
This template is provided as a diagnostic tool for identifying potential algorithmic bias in marketing systems. It is not legal advice and does not guarantee compliance with any specific regulations (GDPR, CCPA, etc.). Use at your own risk. Dennis Consorte, Consorte Marketing, and associated people and organizations assume no responsibility for any losses incurred by the use of these materials and suggestions.
For questions about legal compliance or if you discover patterns that may violate civil rights laws, consult with legal counsel.
The methodologies in this template are based on the Bias-Debt Framework developed by Dennis Consorte and published on HackerNoon.